Chrysler 2012 Annual Report Download - page 152
Download and view the complete annual report
Please find page 152 of the 2012 Chrysler annual report below. You can navigate through the pages in the report by either clicking on the pages listed below, or by using the keyword search tool below to find specific information within the annual report.-
 1
1 -
 2
2 -
 3
3 -
 4
4 -
 5
5 -
 6
6 -
 7
7 -
 8
8 -
 9
9 -
 10
10 -
 11
11 -
 12
12 -
 13
13 -
 14
14 -
 15
15 -
 16
16 -
 17
17 -
 18
18 -
 19
19 -
 20
20 -
 21
21 -
 22
22 -
 23
23 -
 24
24 -
 25
25 -
 26
26 -
 27
27 -
 28
28 -
 29
29 -
 30
30 -
 31
31 -
 32
32 -
 33
33 -
 34
34 -
 35
35 -
 36
36 -
 37
37 -
 38
38 -
 39
39 -
 40
40 -
 41
41 -
 42
42 -
 43
43 -
 44
44 -
 45
45 -
 46
46 -
 47
47 -
 48
48 -
 49
49 -
 50
50 -
 51
51 -
 52
52 -
 53
53 -
 54
54 -
 55
55 -
 56
56 -
 57
57 -
 58
58 -
 59
59 -
 60
60 -
 61
61 -
 62
62 -
 63
63 -
 64
64 -
 65
65 -
 66
66 -
 67
67 -
 68
68 -
 69
69 -
 70
70 -
 71
71 -
 72
72 -
 73
73 -
 74
74 -
 75
75 -
 76
76 -
 77
77 -
 78
78 -
 79
79 -
 80
80 -
 81
81 -
 82
82 -
 83
83 -
 84
84 -
 85
85 -
 86
86 -
 87
87 -
 88
88 -
 89
89 -
 90
90 -
 91
91 -
 92
92 -
 93
93 -
 94
94 -
 95
95 -
 96
96 -
 97
97 -
 98
98 -
 99
99 -
 100
100 -
 101
101 -
 102
102 -
 103
103 -
 104
104 -
 105
105 -
 106
106 -
 107
107 -
 108
108 -
 109
109 -
 110
110 -
 111
111 -
 112
112 -
 113
113 -
 114
114 -
 115
115 -
 116
116 -
 117
117 -
 118
118 -
 119
119 -
 120
120 -
 121
121 -
 122
122 -
 123
123 -
 124
124 -
 125
125 -
 126
126 -
 127
127 -
 128
128 -
 129
129 -
 130
130 -
 131
131 -
 132
132 -
 133
133 -
 134
134 -
 135
135 -
 136
136 -
 137
137 -
 138
138 -
 139
139 -
 140
140 -
 141
141 -
 142
142 -
 143
143 -
 144
144 -
 145
145 -
 146
146 -
 147
147 -
 148
148 -
 149
149 -
 150
150 -
 151
151 -
 152
152 -
 153
153 -
 154
154 -
 155
155 -
 156
156 -
 157
157 -
 158
158 -
 159
159 -
 160
160 -
 161
161 -
 162
162 -
 163
163 -
 164
164 -
 165
165 -
 166
166 -
 167
167 -
 168
168 -
 169
169 -
 170
170 -
 171
171 -
 172
172 -
 173
173 -
 174
174 -
 175
175 -
 176
176 -
 177
177 -
 178
178 -
 179
179 -
 180
180 -
 181
181 -
 182
182 -
 183
183 -
 184
184 -
 185
185 -
 186
186 -
 187
187 -
 188
188 -
 189
189 -
 190
190 -
 191
191 -
 192
192 -
 193
193 -
 194
194 -
 195
195 -
 196
196 -
 197
197 -
 198
198 -
 199
199 -
 200
200 -
 201
201 -
 202
202 -
 203
203 -
 204
204 -
 205
205 -
 206
206 -
 207
207 -
 208
208 -
 209
209 -
 210
210 -
 211
211 -
 212
212 -
 213
213 -
 214
214 -
 215
215 -
 216
216 -
 217
217 -
 218
218 -
 219
219 -
 220
220 -
 221
221 -
 222
222 -
 223
223 -
 224
224 -
 225
225 -
 226
226 -
 227
227 -
 228
228 -
 229
229 -
 230
230 -
 231
231 -
 232
232 -
 233
233 -
 234
234 -
 235
235 -
 236
236 -
 237
237 -
 238
238 -
 239
239 -
 240
240 -
 241
241 -
 242
242 -
 243
243 -
 244
244 -
 245
245 -
 246
246 -
 247
247 -
 248
248 -
 249
249 -
 250
250 -
 251
251 -
 252
252 -
 253
253 -
 254
254 -
 255
255 -
 256
256 -
 257
257 -
 258
258 -
 259
259 -
 260
260 -
 261
261 -
 262
262 -
 263
263 -
 264
264 -
 265
265 -
 266
266 -
 267
267 -
 268
268 -
 269
269 -
 270
270 -
 271
271 -
 272
272 -
 273
273 -
 274
274 -
 275
275 -
 276
276 -
 277
277 -
 278
278 -
 279
279 -
 280
280 -
 281
281 -
 282
282 -
 283
283 -
 284
284 -
 285
285 -
 286
286 -
 287
287 -
 288
288 -
 289
289 -
 290
290 -
 291
291 -
 292
292 -
 293
293 -
 294
294 -
 295
295 -
 296
296 -
 297
297 -
 298
298 -
 299
299 -
 300
300 -
 301
301 -
 302
302 -
 303
303 -
 304
304 -
 305
305 -
 306
306 -
 307
307 -
 308
308 -
 309
309 -
 310
310 -
 311
311 -
 312
312 -
 313
313 -
 314
314 -
 315
315 -
 316
316 -
 317
317 -
 318
318 -
 319
319 -
 320
320 -
 321
321 -
 322
322 -
 323
323 -
 324
324 -
 325
325 -
 326
326 -
 327
327 -
 328
328 -
 329
329 -
 330
330 -
 331
331 -
 332
332 -
 333
333 -
 334
334 -
 335
335 -
 336
336 -
 337
337 -
 338
338 -
 339
339 -
 340
340 -
 341
341 -
 342
342 -
 343
343 -
 344
344 -
 345
345 -
 346
346
 |
 |

151
Consolidated
Financial Statements
at 31 December 2012
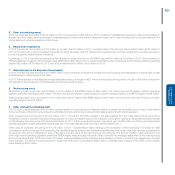
5. Other income/(expenses)
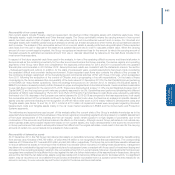
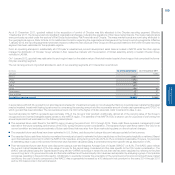
Other net expenses amounting to €103 million in 2012 (net expenses of €49 million in 2011) consists of miscellaneous operating costs not attributable to
specific functional areas, such as accruals to miscellaneous provisions and indirect taxes and duties, net of other income which is not attributable to the
typical sales and services operations of the Group.
6. Result from investments
In 2012 the net gain, amounting to €107 million (a net gain of €131 million in 2011), consists mainly of the Group’s share of €94 million (€146 million in
2011) in the net profit or loss of investees accounted for using the equity method; the item also includes write-downs for impairment, reversals, accruals to
provisions against investments and dividends.
In particular, in 2012, the item includes (amounts in € million): investments held by the EMEA region €160 million (€160 million in 2011), the investment in
RCS MediaGroup in respect of the investee’s loss -€68 million (-€2 million in 2011), investments held by the Components and Production System operating
segment €2 million (-€15 million in 2011) and other investments €13 million (-€12 million in 2011).
7. Gains/(losses) on the disposal of investments
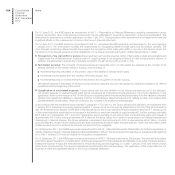
In 2012, this item includes the write-down of €91 million of the investment in Sevelnord Société Anonyme following its reclassification to Assets held for sale
and subsequent measurement at fair value.
In 2011, Gains/(losses) on the disposal of investments amounted to a net gain of €21 million and included, among others, the gain of €8 million arising from
the disposal of the investment in Fiat Switzerland to the Fiat Industrial group.
8. Restructuring costs
Restructuring costs, a net cost of €15 million in 2012, relates to the EMEA region for €43 million, the Component and Production System operating
segment and Other Activities for €20 million. The item includes the release of restructuring provisions previously made by the NAFTA region for €48 million.
Restructuring costs in 2011 amounted to €102 million and mainly related to the EMEA region for €78 million and the Component and Production System
operating segment for €16 million.
9. Other unusual income/(expenses)
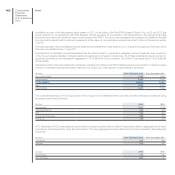
In 2012 other unusual expense of €145 million consists mainly of costs arising from disputes relating to operations terminated in prior years, costs related
to the termination of the joint venture Sevelnord Société Anonyme and to the process of rationalising relations with certain suppliers.
Other unusual income amounted to €2,100 million in 2011. Of this, €1,729 million related to the gain resulting from the measurement at fair value of the
investment of 30% in Chrysler held before the acquisition of control and €288 million to the valuation of the right to receive an additional ownership interest
of 5% following the occurrence of the Ecological Event. In 2011, Other unusual income also included a gain of €69 million on Other post-employment
benefits arising from a plan amendment associated with a Chrysler legal services plan which will terminate in 2013.
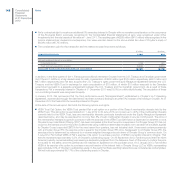
Other unusual expenses, amounting to €1,075 million in 2011, included €220 million relating to the revaluation of the inventories of Chrysler on initial
consolidation as the consequence of measuring the identifiable assets acquired and identifiable liabilities assumed at fair value, this item was recognised as
an expense in the income statement in June of the same year as a result of the rapid turnover of inventories. The amount of €855 million arising from the
other regions and operating segments (mainly the EMEA region) was principally the result of the process for the strategic realignment of the manufacturing
and commercial activities of Fiat with those of Chrysler, which accelerated further following the acquisition of control, as well as the realignment of certain
minor activities. The above-mentioned amount included the write-down of Goodwill by €224 million, of Development costs by €161 million, and of certain
Fixed assets by €302 million.
