Chrysler 2012 Annual Report Download - page 15
Download and view the complete annual report
Please find page 15 of the 2012 Chrysler annual report below. You can navigate through the pages in the report by either clicking on the pages listed below, or by using the keyword search tool below to find specific information within the annual report.-
 1
1 -
2
-
3
-
4
-
 5
5 -
 6
6 -
 7
7 -
 8
8 -
 9
9 -
 10
10 -
 11
11 -
 12
12 -
 13
13 -
 14
14 -
 15
15 -
 16
16 -
 17
17 -
 18
18 -
 19
19 -
 20
20 -
 21
21 -
 22
22 -
 23
23 -
 24
24 -
 25
25 -
26
-
27
-
28
-
29
-
30
-
31
-
32
-
33
-
34
-
35
-
36
-
37
-
38
-
39
-
40
-
41
-
42
-
43
-
44
-
45
-
46
-
47
-
48
-
49
-
50
-
51
-
52
-
53
-
54
-
55
-
56
-
57
-
58
-
59
-
60
-
61
-
62
-
63
-
64
-
65
-
66
-
67
-
68
-
69
-
70
-
71
-
72
-
73
-
74
-
75
-
76
-
77
-
78
-
79
-
80
-
81
-
82
-
83
-
84
-
85
-
86
-
87
-
88
-
89
-
90
-
91
-
92
-
93
-
94
-
95
-
96
-
97
-
98
-
99
-
100
-
101
-
102
-
103
-
104
-
105
-
106
-
107
-
108
-
109
-
110
-
111
-
112
-
113
-
114
-
115
-
116
-
117
-
118
-
119
-
120
-
121
-
122
-
123
-
124
-
125
-
126
-
127
-
128
-
129
-
130
-
131
-
132
-
133
-
134
-
135
-
136
-
137
-
138
-
139
-
140
-
141
-
142
-
143
-
144
-
145
-
146
-
147
-
148
-
149
-
150
-
151
-
152
-
153
-
154
-
155
-
156
-
157
-
158
-
159
-
160
-
161
-
162
-
163
-
164
-
165
-
166
-
167
-
168
-
169
-
170
-
171
-
172
-
173
-
174
-
175
-
176
-
177
-
178
-
179
-
180
-
181
-
182
-
183
-
184
-
185
-
186
-
187
-
188
-
189
-
190
-
191
-
192
-
193
-
194
-
195
-
196
-
197
-
198
-
199
-
200
-
201
-
202
-
203
-
204
-
205
-
206
-
207
-
208
-
209
-
210
-
211
-
212
-
213
-
214
-
215
-
216
-
217
-
218
-
219
-
220
-
221
-
222
-
223
-
224
-
225
-
226
-
227
-
228
-
229
-
230
-
231
-
232
-
233
-
234
-
235
-
236
-
237
-
238
-
239
-
240
-
241
-
242
-
243
-
244
-
245
-
246
-
247
-
248
-
249
-
250
-
251
-
252
-
253
-
254
-
255
-
256
-
257
-
258
-
259
-
260
-
261
-
262
-
263
-
264
-
265
-
266
-
267
-
268
-
269
-
270
-
271
-
272
-
273
-
274
-
275
-
276
-
277
-
278
-
279
-
280
-
281
-
282
-
283
-
284
-
285
-
286
-
287
-
288
-
289
-
290
-
291
-
292
-
293
-
294
-
295
-
296
-
297
-
298
-
299
-
300
-
301
-
302
-
303
-
304
-
305
-
306
-
307
-
308
-
309
-
310
-
311
-
312
-
313
-
314
-
315
-
316
-
317
-
318
-
319
-
320
-
321
-
322
-
323
-
324
-
325
-
326
-
327
-
328
-
329
-
330
-
331
-
332
-
333
-
334
-
335
-
336
-
337
-
338
-
339
-
340
-
341
-
342
-
343
-
344
-
345
-
346
 |
 |

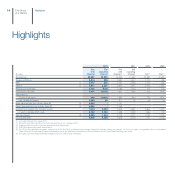
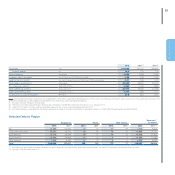
14
Highlights
2012 2011 2010 2009
(€ million)
Fiat
with
Chrysler
Fiat
excluding
Chrysler
Fiat
with
Chrysler (*)
Fiat
excluding
Chrysler Fiat (**) Fiat (**)
Net revenues 83,957 35,566 59,559 37,382 35,880 32,684
Trading profit/(loss) 3,814 355 2,392 1,047 1,112 736
EBIT (1) 3,677 204 3,467 2,266 1,106 455
EBITDA (2) 7,811 2,321 6,825 4,501 3,292 2,491
Profit/(loss) before taxes 2,036 (621) 2,185 1,470 706 103
Profit/(loss) for the year 1,411 (1,041) 1,651 1,006 222 (345)
Attributable to:
Owners of the parent 348 (1,087) 1,334 980 179 (374)
Non-controlling interests 1,063 46 317 26 43 29
Basic earnings/(loss) per ordinary share (€)(3) 0.286 - 1.101 - - -
Diluted earnings/(loss) per ordinary share (€)(3) 0.284 - 1.093 - - -
Investments in tangible and intangible assets 7,534 3,223 5,528 3,592 2,864 2,684
of which: capitalized R&D costs 2,138 1,080 1,438 1,059 886 748
R&D expenditure (4) 3,295 1,464 2,175 1,411 1,284 1,154
Net industrial debt 6,545 5,048 5,529 2,449 542 3,103
(*) Includes Chrysler from June 2011.
(**) Excludes activities transferred to Fiat Industrial S.p.A. on 1 January 2011.
(1) Trading profit/(loss) plus unusuals and result from investments.
(2) EBIT plus depreciation and amortization.
(3) For 2011, the calculation assumes conversion of all Fiat S.p.A. preference and savings shares into ordinary shares on January 1st. For prior years, comparable data is not available.
Note 13 to the Consolidated Financial Statements provides additional information on the calculation of basic and diluted earnings per share.
(4) Includes capitalized R&D and R&D charged directly to the income statement.
Highlights
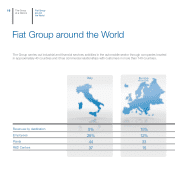
The Group
at a Glance