Chrysler 2012 Annual Report Download - page 115
Download and view the complete annual report
Please find page 115 of the 2012 Chrysler annual report below. You can navigate through the pages in the report by either clicking on the pages listed below, or by using the keyword search tool below to find specific information within the annual report.-
 1
1 -
2
-
3
-
4
-
5
-
6
-
7
-
8
-
9
-
10
-
11
-
12
-
13
-
14
-
15
-
16
-
17
-
18
-
19
-
20
-
21
-
22
-
23
-
24
-
25
-
26
-
27
-
28
-
29
-
30
-
31
-
32
-
33
-
34
-
35
-
36
-
37
-
38
-
39
-
40
-
41
-
42
-
43
-
44
-
45
-
46
-
47
-
48
-
49
-
50
-
51
-
52
-
53
-
54
-
55
-
56
-
57
-
58
-
59
-
60
-
61
-
62
-
63
-
64
-
65
-
66
-
67
-
68
-
69
-
70
-
71
-
72
-
73
-
74
-
75
-
76
-
77
-
78
-
79
-
80
-
81
-
82
-
83
-
84
-
85
-
86
-
87
-
88
-
89
-
90
-
91
-
92
-
93
-
94
-
95
-
96
-
97
-
98
-
99
-
100
-
101
-
102
-
103
-
104
-
 105
105 -
 106
106 -
 107
107 -
 108
108 -
 109
109 -
 110
110 -
 111
111 -
 112
112 -
 113
113 -
 114
114 -
 115
115 -
 116
116 -
 117
117 -
 118
118 -
 119
119 -
 120
120 -
 121
121 -
 122
122 -
 123
123 -
 124
124 -
 125
125 -
126
-
127
-
128
-
129
-
130
-
131
-
132
-
133
-
134
-
135
-
136
-
137
-
138
-
139
-
140
-
141
-
142
-
143
-
144
-
145
-
146
-
147
-
148
-
149
-
150
-
151
-
152
-
153
-
154
-
155
-
156
-
157
-
158
-
159
-
160
-
161
-
162
-
163
-
164
-
165
-
166
-
167
-
168
-
169
-
170
-
171
-
172
-
173
-
174
-
175
-
176
-
177
-
178
-
179
-
180
-
181
-
182
-
183
-
184
-
185
-
186
-
187
-
188
-
189
-
190
-
191
-
192
-
193
-
194
-
195
-
196
-
197
-
198
-
199
-
200
-
201
-
202
-
203
-
204
-
205
-
206
-
207
-
208
-
209
-
210
-
211
-
212
-
213
-
214
-
215
-
216
-
217
-
218
-
219
-
220
-
221
-
222
-
223
-
224
-
225
-
226
-
227
-
228
-
229
-
230
-
231
-
232
-
233
-
234
-
235
-
236
-
237
-
238
-
239
-
240
-
241
-
242
-
243
-
244
-
245
-
246
-
247
-
248
-
249
-
250
-
251
-
252
-
253
-
254
-
255
-
256
-
257
-
258
-
259
-
260
-
261
-
262
-
263
-
264
-
265
-
266
-
267
-
268
-
269
-
270
-
271
-
272
-
273
-
274
-
275
-
276
-
277
-
278
-
279
-
280
-
281
-
282
-
283
-
284
-
285
-
286
-
287
-
288
-
289
-
290
-
291
-
292
-
293
-
294
-
295
-
296
-
297
-
298
-
299
-
300
-
301
-
302
-
303
-
304
-
305
-
306
-
307
-
308
-
309
-
310
-
311
-
312
-
313
-
314
-
315
-
316
-
317
-
318
-
319
-
320
-
321
-
322
-
323
-
324
-
325
-
326
-
327
-
328
-
329
-
330
-
331
-
332
-
333
-
334
-
335
-
336
-
337
-
338
-
339
-
340
-
341
-
342
-
343
-
344
-
345
-
346
 |
 |

114
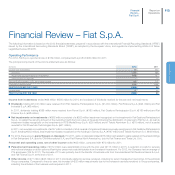
Net financial expense totaled €216 million, which included €250 million in financial charges, relating primarily to interest expense on debt, partially
offset by income of €34 million arising from the fair value measurement of stock-option related equity swaps on Fiat and Fiat Industrial shares. For 2011,
net financial expense totaled €435 million, which included €327 million in financial charges, relating primarily to interest expense on debt, in addition to a
€108 million loss arising from the fair value measurement of the above equity swaps. The €219 million decrease in net financial expense over 2011 was
attributable to the swing in value of the equity swaps (€142 million), as well as a reduction in costs associated with the lower average level of indebtedness
(€77 million).
For income taxes, the Company recognized a €31 million credit for the year (€44 million in 2011), which was primarily attributable to compensation
received for tax losses contributed by Fiat S.p.A. to the national tax consolidation for the Group’s Italian companies.
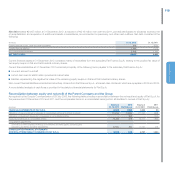
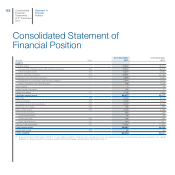
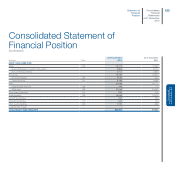
Statement of Financial Position
The principal components of the statement of financial position were as follows:
(€ million) 31.12.2012 31.12.2011
Non-current assets 11,809 12,169
of which: Investments 11,765 12,123
Working capital (260) (253)
NET CAPITAL INVESTED 11,549 11,916
EQUITY 8,902 9,053
NET DEBT 2,647 2,863
Non-current assets consisted almost entirely of controlling interests in the principal Group companies.
The €358 million decrease in investments over 31 December 2011 was primarily attributable to the net effect of impairments and reversals on investments
(€962 million) commented on above, net of the recapitalization of certain subsidiaries (€444 million) and acquisition of additional interests in subsidiaries
(€131 million), in addition to the fair value revaluation of investments in other companies.
Working capital was a negative €260 million and consisted of trade receivables/payables, other receivables/payables (from/to tax authorities, employees,
etc.), contract work in progress net of advances, and provisions for the period. The €7 million decrease over 31 December 2011 mainly reflects the
receivable/payable position with subsidiaries and tax receivables for consolidated IRES income taxes.
Equity totaled €8,902 million at 31 December 2012, a reduction of €151 million over year-end 2011 primarily due to the loss for the year (€152 million)
and dividends (€40 million), partially offset by the fair value revaluation of investments in other companies.
A more detailed analysis of changes in equity is provided in the statutory financial statements for Fiat S.p.A.
Financial
Review –
Fiat S.p.A.
Report on
Operations