Chrysler 2012 Annual Report Download - page 292
Download and view the complete annual report
Please find page 292 of the 2012 Chrysler annual report below. You can navigate through the pages in the report by either clicking on the pages listed below, or by using the keyword search tool below to find specific information within the annual report.-
 1
1 -
2
-
3
-
4
-
5
-
6
-
7
-
8
-
9
-
10
-
11
-
12
-
13
-
14
-
15
-
16
-
17
-
18
-
19
-
20
-
21
-
22
-
23
-
24
-
25
-
26
-
27
-
28
-
29
-
30
-
31
-
32
-
33
-
34
-
35
-
36
-
37
-
38
-
39
-
40
-
41
-
42
-
43
-
44
-
45
-
46
-
47
-
48
-
49
-
50
-
51
-
52
-
53
-
54
-
55
-
56
-
57
-
58
-
59
-
60
-
61
-
62
-
63
-
64
-
65
-
66
-
67
-
68
-
69
-
70
-
71
-
72
-
73
-
74
-
75
-
76
-
77
-
78
-
79
-
80
-
81
-
82
-
83
-
84
-
85
-
86
-
87
-
88
-
89
-
90
-
91
-
92
-
93
-
94
-
95
-
96
-
97
-
98
-
99
-
100
-
101
-
102
-
103
-
104
-
105
-
106
-
107
-
108
-
109
-
110
-
111
-
112
-
113
-
114
-
115
-
116
-
117
-
118
-
119
-
120
-
121
-
122
-
123
-
124
-
125
-
126
-
127
-
128
-
129
-
130
-
131
-
132
-
133
-
134
-
135
-
136
-
137
-
138
-
139
-
140
-
141
-
142
-
143
-
144
-
145
-
146
-
147
-
148
-
149
-
150
-
151
-
152
-
153
-
154
-
155
-
156
-
157
-
158
-
159
-
160
-
161
-
162
-
163
-
164
-
165
-
166
-
167
-
168
-
169
-
170
-
171
-
172
-
173
-
174
-
175
-
176
-
177
-
178
-
179
-
180
-
181
-
182
-
183
-
184
-
185
-
186
-
187
-
188
-
189
-
190
-
191
-
192
-
193
-
194
-
195
-
196
-
197
-
198
-
199
-
200
-
201
-
202
-
203
-
204
-
205
-
206
-
207
-
208
-
209
-
210
-
211
-
212
-
213
-
214
-
215
-
216
-
217
-
218
-
219
-
220
-
221
-
222
-
223
-
224
-
225
-
226
-
227
-
228
-
229
-
230
-
231
-
232
-
233
-
234
-
235
-
236
-
237
-
238
-
239
-
240
-
241
-
242
-
243
-
244
-
245
-
246
-
247
-
248
-
249
-
250
-
251
-
252
-
253
-
254
-
255
-
256
-
257
-
258
-
259
-
260
-
261
-
262
-
263
-
264
-
265
-
266
-
267
-
268
-
269
-
270
-
271
-
272
-
273
-
274
-
275
-
276
-
277
-
278
-
279
-
280
-
281
-
 282
282 -
 283
283 -
 284
284 -
 285
285 -
 286
286 -
 287
287 -
 288
288 -
 289
289 -
 290
290 -
 291
291 -
 292
292 -
 293
293 -
 294
294 -
 295
295 -
 296
296 -
 297
297 -
 298
298 -
 299
299 -
 300
300 -
 301
301 -
 302
302 -
303
-
304
-
305
-
306
-
307
-
308
-
309
-
310
-
311
-
312
-
313
-
314
-
315
-
316
-
317
-
318
-
319
-
320
-
321
-
322
-
323
-
324
-
325
-
326
-
327
-
328
-
329
-
330
-
331
-
332
-
333
-
334
-
335
-
336
-
337
-
338
-
339
-
340
-
341
-
342
-
343
-
344
-
345
-
346
 |
 |

291
Fiat S.p.A. - Statutory
Financial Statements
at 31 December 2012
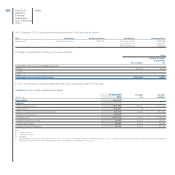
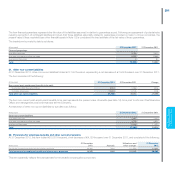
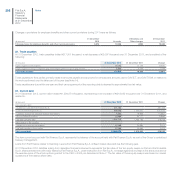
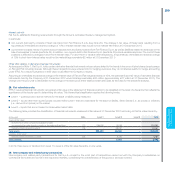
The item financial guarantees represents the fair value of the liabilities assumed in relation to guarantees issued. Following an assessment of potential risks
requiring recognition of contingent liabilities and given that those liabilities essentially related to guarantees provided on loans to Group companies, the
present value of fees receivable (see other financial assets in Note 12) is considered the best estimate of the fair value of those guarantees.
The breakdown by maturity date is as follows:
(€ thousand) 31 December 2012 31 December 2011
Financial guarantees
due within one year 3,789 3,920
due after one year but within five years 8,242 8,888
due beyond five years 484
Total 12,035 12,892
21. Other non-current liabilities
At 31 December 2012, other non-current liabilities totaled €17,165 thousand, representing a net decrease of €1,049 thousand over 31 December 2011.
The item consisted of the following:
(€ thousand) 31 December 2012 31 December 2011 Change
Non-current post-employment benefits to be paid:
to a former Chief Executive Officer 3,743 4,069 (326)
to former employees 13,422 14,145 (723)
Total other non-current liabilities 17,165 18,214 (1,049)
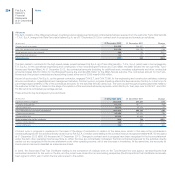
The item non-current post-employment benefits to be paid represents the present value of benefits (see Note 19) to be paid to a former Chief Executive
Officer and management personnel that have left the Company.
A breakdown of other non-current liabilities by due date is as follows:
(€ thousand) 31 December 2012 31 December 2011
Other non-current liabilities
due within one year 1,087 1,050
due after one year but within five years 4,748 5,834
due beyond five years 11,330 11,330
Total 17,165 18,214
22. Provisions for employee benefits and other current provisions
At 31 December 2012, this item totaled €15,251 thousand, a net decrease of €4,129 thousand over 31 December 2011, and consisted of the following:
(€ thousand)
31 December
2011 Accruals
Utilizations and
Other changes
31 December
2012
Provisions for employee bonuses and similar provisions 19,380 7,430 (11,559) 15,251
Total provisions for employee benefits and other current provisions 19,380 7,430 (11,559) 15,251
This item essentially reflects the best estimate for the variable compensation component.