Chrysler 2012 Annual Report Download - page 63
Download and view the complete annual report
Please find page 63 of the 2012 Chrysler annual report below. You can navigate through the pages in the report by either clicking on the pages listed below, or by using the keyword search tool below to find specific information within the annual report.-
 1
1 -
2
-
3
-
4
-
5
-
6
-
7
-
8
-
9
-
10
-
11
-
12
-
13
-
14
-
15
-
16
-
17
-
18
-
19
-
20
-
21
-
22
-
23
-
24
-
25
-
26
-
27
-
28
-
29
-
30
-
31
-
32
-
33
-
34
-
35
-
36
-
37
-
38
-
39
-
40
-
41
-
42
-
43
-
44
-
45
-
46
-
47
-
48
-
49
-
50
-
51
-
52
-
 53
53 -
 54
54 -
 55
55 -
 56
56 -
 57
57 -
 58
58 -
 59
59 -
 60
60 -
 61
61 -
 62
62 -
 63
63 -
 64
64 -
 65
65 -
 66
66 -
 67
67 -
 68
68 -
 69
69 -
 70
70 -
 71
71 -
 72
72 -
 73
73 -
74
-
75
-
76
-
77
-
78
-
79
-
80
-
81
-
82
-
83
-
84
-
85
-
86
-
87
-
88
-
89
-
90
-
91
-
92
-
93
-
94
-
95
-
96
-
97
-
98
-
99
-
100
-
101
-
102
-
103
-
104
-
105
-
106
-
107
-
108
-
109
-
110
-
111
-
112
-
113
-
114
-
115
-
116
-
117
-
118
-
119
-
120
-
121
-
122
-
123
-
124
-
125
-
126
-
127
-
128
-
129
-
130
-
131
-
132
-
133
-
134
-
135
-
136
-
137
-
138
-
139
-
140
-
141
-
142
-
143
-
144
-
145
-
146
-
147
-
148
-
149
-
150
-
151
-
152
-
153
-
154
-
155
-
156
-
157
-
158
-
159
-
160
-
161
-
162
-
163
-
164
-
165
-
166
-
167
-
168
-
169
-
170
-
171
-
172
-
173
-
174
-
175
-
176
-
177
-
178
-
179
-
180
-
181
-
182
-
183
-
184
-
185
-
186
-
187
-
188
-
189
-
190
-
191
-
192
-
193
-
194
-
195
-
196
-
197
-
198
-
199
-
200
-
201
-
202
-
203
-
204
-
205
-
206
-
207
-
208
-
209
-
210
-
211
-
212
-
213
-
214
-
215
-
216
-
217
-
218
-
219
-
220
-
221
-
222
-
223
-
224
-
225
-
226
-
227
-
228
-
229
-
230
-
231
-
232
-
233
-
234
-
235
-
236
-
237
-
238
-
239
-
240
-
241
-
242
-
243
-
244
-
245
-
246
-
247
-
248
-
249
-
250
-
251
-
252
-
253
-
254
-
255
-
256
-
257
-
258
-
259
-
260
-
261
-
262
-
263
-
264
-
265
-
266
-
267
-
268
-
269
-
270
-
271
-
272
-
273
-
274
-
275
-
276
-
277
-
278
-
279
-
280
-
281
-
282
-
283
-
284
-
285
-
286
-
287
-
288
-
289
-
290
-
291
-
292
-
293
-
294
-
295
-
296
-
297
-
298
-
299
-
300
-
301
-
302
-
303
-
304
-
305
-
306
-
307
-
308
-
309
-
310
-
311
-
312
-
313
-
314
-
315
-
316
-
317
-
318
-
319
-
320
-
321
-
322
-
323
-
324
-
325
-
326
-
327
-
328
-
329
-
330
-
331
-
332
-
333
-
334
-
335
-
336
-
337
-
338
-
339
-
340
-
341
-
342
-
343
-
344
-
345
-
346
 |
 |

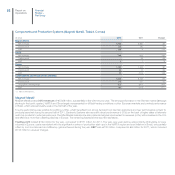
62
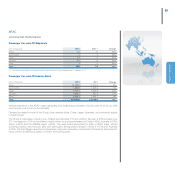
Industrial Activities
For 2012, Industrial Activities absorbed cash and cash equivalents of €18 million. Excluding Chrysler (which generated cash and cash equivalents of
€1,383 million), Fiat absorbed €1,401 million in cash.
Operating activities generated €6,339 million in cash, of which €5,889 million attributable to Chrysler and €450 million attributable to Fiat excluding
Chrysler. Operating cash flow for Fiat excluding Chrysler was impacted by a €581 million increase in working capital.
Investing activities absorbed a total of €7,457 million, primarily for investments in tangible and intangible assets (€7,530 million, of which €3,219
million attributable to Fiat excluding Chrysler).
Financing activities generated €1,500 million in cash related primarily to a net increase in borrowings (approximately €1.1 billion in net bond
proceeds and €0.5 billion in other debt), which was partially offset by dividend payments to Fiat S.p.A. shareholders and minorities in group subsidiaries
(€58 million).
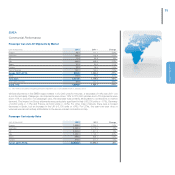
Financial Services
Cash and cash equivalents for Financial Services totaled €246 million at 31 December 2012, increasing €149 million over the beginning of the year.
Changes in cash were attributable to:
Operating activities, which generated €119 million in cash (principally net profit plus amortization and depreciation).
Investing activities (including changes in financial receivables from/debt payable to industrial companies), which absorbed €82 million in cash,
primarily due to an increase in the lending portfolio, net of repayment of loans from treasury companies (included under other changes).
Financing activities, which generated a total of €131 million in cash, consisting of €143 million of net inflows from new financing, net of dividends
paid to companies included under Industrial Activities.
Financial
Review –
Fiat Group
Report on
Operations