Chrysler 2012 Annual Report Download - page 208
Download and view the complete annual report
Please find page 208 of the 2012 Chrysler annual report below. You can navigate through the pages in the report by either clicking on the pages listed below, or by using the keyword search tool below to find specific information within the annual report.-
 1
1 -
2
-
3
-
4
-
5
-
6
-
7
-
8
-
9
-
10
-
11
-
12
-
13
-
14
-
15
-
16
-
17
-
18
-
19
-
20
-
21
-
22
-
23
-
24
-
25
-
26
-
27
-
28
-
29
-
30
-
31
-
32
-
33
-
34
-
35
-
36
-
37
-
38
-
39
-
40
-
41
-
42
-
43
-
44
-
45
-
46
-
47
-
48
-
49
-
50
-
51
-
52
-
53
-
54
-
55
-
56
-
57
-
58
-
59
-
60
-
61
-
62
-
63
-
64
-
65
-
66
-
67
-
68
-
69
-
70
-
71
-
72
-
73
-
74
-
75
-
76
-
77
-
78
-
79
-
80
-
81
-
82
-
83
-
84
-
85
-
86
-
87
-
88
-
89
-
90
-
91
-
92
-
93
-
94
-
95
-
96
-
97
-
98
-
99
-
100
-
101
-
102
-
103
-
104
-
105
-
106
-
107
-
108
-
109
-
110
-
111
-
112
-
113
-
114
-
115
-
116
-
117
-
118
-
119
-
120
-
121
-
122
-
123
-
124
-
125
-
126
-
127
-
128
-
129
-
130
-
131
-
132
-
133
-
134
-
135
-
136
-
137
-
138
-
139
-
140
-
141
-
142
-
143
-
144
-
145
-
146
-
147
-
148
-
149
-
150
-
151
-
152
-
153
-
154
-
155
-
156
-
157
-
158
-
159
-
160
-
161
-
162
-
163
-
164
-
165
-
166
-
167
-
168
-
169
-
170
-
171
-
172
-
173
-
174
-
175
-
176
-
177
-
178
-
179
-
180
-
181
-
182
-
183
-
184
-
185
-
186
-
187
-
188
-
189
-
190
-
191
-
192
-
193
-
194
-
195
-
196
-
197
-
 198
198 -
 199
199 -
 200
200 -
 201
201 -
 202
202 -
 203
203 -
 204
204 -
 205
205 -
 206
206 -
 207
207 -
 208
208 -
 209
209 -
 210
210 -
 211
211 -
 212
212 -
 213
213 -
 214
214 -
 215
215 -
 216
216 -
 217
217 -
 218
218 -
219
-
220
-
221
-
222
-
223
-
224
-
225
-
226
-
227
-
228
-
229
-
230
-
231
-
232
-
233
-
234
-
235
-
236
-
237
-
238
-
239
-
240
-
241
-
242
-
243
-
244
-
245
-
246
-
247
-
248
-
249
-
250
-
251
-
252
-
253
-
254
-
255
-
256
-
257
-
258
-
259
-
260
-
261
-
262
-
263
-
264
-
265
-
266
-
267
-
268
-
269
-
270
-
271
-
272
-
273
-
274
-
275
-
276
-
277
-
278
-
279
-
280
-
281
-
282
-
283
-
284
-
285
-
286
-
287
-
288
-
289
-
290
-
291
-
292
-
293
-
294
-
295
-
296
-
297
-
298
-
299
-
300
-
301
-
302
-
303
-
304
-
305
-
306
-
307
-
308
-
309
-
310
-
311
-
312
-
313
-
314
-
315
-
316
-
317
-
318
-
319
-
320
-
321
-
322
-
323
-
324
-
325
-
326
-
327
-
328
-
329
-
330
-
331
-
332
-
333
-
334
-
335
-
336
-
337
-
338
-
339
-
340
-
341
-
342
-
343
-
344
-
345
-
346
 |
 |

207
Consolidated
Financial Statements
at 31 December 2012
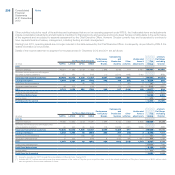
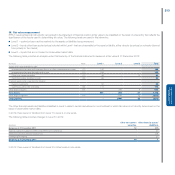
Unallocated items, and in particular financial income /(expenses), are not attributed to the regions and operating segments as they do not fall under the
scope of their operational responsibilities and are therefore assessed separately. These items arise from the management of treasury assets and liabilities
by the treasuries of Fiat and Chrysler, which work independently and separately within the Group.
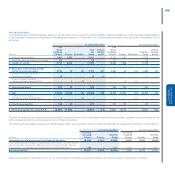
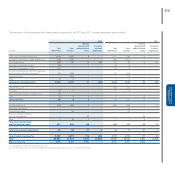
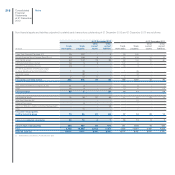
The Group’s treasury assets and liabilities are as follows, as also reported in the Report on Operations:
At 31 December 2012 At 31 December 2011
(€ million) Notes
Fiat Group
with
Chrysler Chrysler
Fiat Group
excluding
Chrysler
Fiat Group
with
Chrysler Chrysler
Fiat Group
excluding
Chrysler
Debt: (28) (27,889) (10,312) (17,586) (26,772) (10,537) (16,245)
Asset-backed financing (28) (449) - (449) (710) (31) (679)
Other debt (28) (27,440) (10,312) (17,137) (26,062) (10,506) (15,566)
Current financial receivables from jointly-controlled
financial services companies (a) 58 - 58 21 - 21
Intersegment financial receivables (b) - 9 - - 10 -
Debt, net of current financial receivables from jointly-controlled
financial services companies (27,831) (10,303) (17,528) (26,751) (10,527) (16,224)
Other financial assets (c) (21) 519 45 474 557 127 430
Other financial liabilities (c) (21) (201) (42) (159) (429) (100) (329)
Current securities (20) 256 - 256 199 - 199
Cash and cash equivalents (22) 17,657 8,803 8,854 17,526 7,420 10,106
Net debt (9,600) (1,497) (8,103) (8,898) (3,080) (5,818)
Industrial Activities (6,545) (1,497) (5,048) (5,529) (3,080) (2,449)
Financial Services (3,055) - (3,055) (3,369) - (3,369)
Cash, cash equivalents and current securities 17,913 8,803 9,110 17,725 7,420 10,305
Undrawn committed credit lines (28) 2,935 985 1,950 2,955 1,005 1,950
Total available liquidity 20,848 9,788 11,060 20,680 8,425 12,255
(a) Includes current financial receivables from FGA Capital.
(b) Includes the value of intercompany agreements recognized as finance leases (IFRIC 4).
(c) Includes fair value of derivative financial instruments.
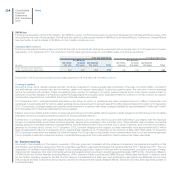
34. Information by geographical area
The Group’s parent company has its registered office in Italy. In 2012, revenues earned from external customers may be analysed as follows:
(€ million) 2012 2011
Italy 7,275 9,258
Rest of the world 76,682 50,301
Total revenues from external customers 83,957 59,559
Revenues earned from external customers in the Rest of the world in 2012 arise mainly from (in €million): United States, Canada and Mexico 45,170 (21,423
in 2011), Brazil for 9,834 (9,860 in 2011), Germany 3,167 (3,158 in 2011), China 2,697 (1,557 in 2011), France 2,055 (2,251 in 2011), UK 1,429 (1,321 in
2011), Turkey for 1,236 (1,357 in 2011), and Spain for 873 (1,019 in 2011).
In 2012 and 2011, no single external customer of the Group accounted for 10% or more of consolidated revenues.