Chrysler 2012 Annual Report Download - page 72
Download and view the complete annual report
Please find page 72 of the 2012 Chrysler annual report below. You can navigate through the pages in the report by either clicking on the pages listed below, or by using the keyword search tool below to find specific information within the annual report.-
 1
1 -
2
-
3
-
4
-
5
-
6
-
7
-
8
-
9
-
10
-
11
-
12
-
13
-
14
-
15
-
16
-
17
-
18
-
19
-
20
-
21
-
22
-
23
-
24
-
25
-
26
-
27
-
28
-
29
-
30
-
31
-
32
-
33
-
34
-
35
-
36
-
37
-
38
-
39
-
40
-
41
-
42
-
43
-
44
-
45
-
46
-
47
-
48
-
49
-
50
-
51
-
52
-
53
-
54
-
55
-
56
-
57
-
58
-
59
-
60
-
61
-
 62
62 -
 63
63 -
 64
64 -
 65
65 -
 66
66 -
 67
67 -
 68
68 -
 69
69 -
 70
70 -
 71
71 -
 72
72 -
 73
73 -
 74
74 -
 75
75 -
 76
76 -
 77
77 -
 78
78 -
 79
79 -
 80
80 -
 81
81 -
 82
82 -
83
-
84
-
85
-
86
-
87
-
88
-
89
-
90
-
91
-
92
-
93
-
94
-
95
-
96
-
97
-
98
-
99
-
100
-
101
-
102
-
103
-
104
-
105
-
106
-
107
-
108
-
109
-
110
-
111
-
112
-
113
-
114
-
115
-
116
-
117
-
118
-
119
-
120
-
121
-
122
-
123
-
124
-
125
-
126
-
127
-
128
-
129
-
130
-
131
-
132
-
133
-
134
-
135
-
136
-
137
-
138
-
139
-
140
-
141
-
142
-
143
-
144
-
145
-
146
-
147
-
148
-
149
-
150
-
151
-
152
-
153
-
154
-
155
-
156
-
157
-
158
-
159
-
160
-
161
-
162
-
163
-
164
-
165
-
166
-
167
-
168
-
169
-
170
-
171
-
172
-
173
-
174
-
175
-
176
-
177
-
178
-
179
-
180
-
181
-
182
-
183
-
184
-
185
-
186
-
187
-
188
-
189
-
190
-
191
-
192
-
193
-
194
-
195
-
196
-
197
-
198
-
199
-
200
-
201
-
202
-
203
-
204
-
205
-
206
-
207
-
208
-
209
-
210
-
211
-
212
-
213
-
214
-
215
-
216
-
217
-
218
-
219
-
220
-
221
-
222
-
223
-
224
-
225
-
226
-
227
-
228
-
229
-
230
-
231
-
232
-
233
-
234
-
235
-
236
-
237
-
238
-
239
-
240
-
241
-
242
-
243
-
244
-
245
-
246
-
247
-
248
-
249
-
250
-
251
-
252
-
253
-
254
-
255
-
256
-
257
-
258
-
259
-
260
-
261
-
262
-
263
-
264
-
265
-
266
-
267
-
268
-
269
-
270
-
271
-
272
-
273
-
274
-
275
-
276
-
277
-
278
-
279
-
280
-
281
-
282
-
283
-
284
-
285
-
286
-
287
-
288
-
289
-
290
-
291
-
292
-
293
-
294
-
295
-
296
-
297
-
298
-
299
-
300
-
301
-
302
-
303
-
304
-
305
-
306
-
307
-
308
-
309
-
310
-
311
-
312
-
313
-
314
-
315
-
316
-
317
-
318
-
319
-
320
-
321
-
322
-
323
-
324
-
325
-
326
-
327
-
328
-
329
-
330
-
331
-
332
-
333
-
334
-
335
-
336
-
337
-
338
-
339
-
340
-
341
-
342
-
343
-
344
-
345
-
346
 |
 |

71
Report on Operations
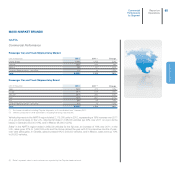
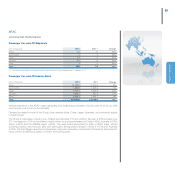
EMEA
Commercial Performance
Passenger Car and LCV Shipments by Market
(units in thousands) 2012 2011 (*) Change
France 82.2 111.1 -26%
Germany 109.6 123.8 -11%
UK 71.2 65.8 8%
Italy 446.9 558.5 -20%
Spain 27.3 30.6 -11%
Poland 24.5 28.6 -14%
Rest of Europe 134.1 165.6 -19%
Europe (UE27+EFTA) 895.8 1,084.0 -17%
Other 115.8 95.6 21%
Total Sales 1,011.6 1,179.6 -14%
Associates and JVs 87.9 141.1 -38%
Grand Total 1,099.5 1,320.7 -17%
(*) Pro-forma calculation including Chrysler shipments as if consolidated from 1 January 2011.
Vehicle shipments in the EMEA region totaled 1,012,000 units for the year, a decrease of 14% over 2011 (on
a pro-forma basis). Passenger car shipments were down 14% to 810,000 vehicles and LCV shipments were
down 15% to 202,000. For passenger cars, the decrease was primarily attributable to contractions in market
demand. The impact on Group shipments was particularly significant in Italy (-80,200 units or -17%), Germany
(-12,600 units or -17%) and France (-23,000 units or -30%). For other major markets, there was a modest
decrease in Spain, but an increase in the UK (+5,100 units or +9%). For LCVs, the year-over-year drop in
volumes was almost entirely attributable to the severe market contraction in Italy.
Passenger Car Industry Sales
(units in thousands) 2012 2011 Change
France 1,898.8 2,204.2 -14%
Germany 3,082.5 3,173.6 -3%
UK 2,044.6 1,941.3 5%
Italy 1,402.1 1,749.7 -20%
Spain 699.6 808.1 -13%
Poland 273.6 277.4 -1%
Europe (UE27+EFTA) 12,528.0 13,593.0 -8%