Chrysler 2012 Annual Report Download - page 211
Download and view the complete annual report
Please find page 211 of the 2012 Chrysler annual report below. You can navigate through the pages in the report by either clicking on the pages listed below, or by using the keyword search tool below to find specific information within the annual report.-
 1
1 -
2
-
3
-
4
-
5
-
6
-
7
-
8
-
9
-
10
-
11
-
12
-
13
-
14
-
15
-
16
-
17
-
18
-
19
-
20
-
21
-
22
-
23
-
24
-
25
-
26
-
27
-
28
-
29
-
30
-
31
-
32
-
33
-
34
-
35
-
36
-
37
-
38
-
39
-
40
-
41
-
42
-
43
-
44
-
45
-
46
-
47
-
48
-
49
-
50
-
51
-
52
-
53
-
54
-
55
-
56
-
57
-
58
-
59
-
60
-
61
-
62
-
63
-
64
-
65
-
66
-
67
-
68
-
69
-
70
-
71
-
72
-
73
-
74
-
75
-
76
-
77
-
78
-
79
-
80
-
81
-
82
-
83
-
84
-
85
-
86
-
87
-
88
-
89
-
90
-
91
-
92
-
93
-
94
-
95
-
96
-
97
-
98
-
99
-
100
-
101
-
102
-
103
-
104
-
105
-
106
-
107
-
108
-
109
-
110
-
111
-
112
-
113
-
114
-
115
-
116
-
117
-
118
-
119
-
120
-
121
-
122
-
123
-
124
-
125
-
126
-
127
-
128
-
129
-
130
-
131
-
132
-
133
-
134
-
135
-
136
-
137
-
138
-
139
-
140
-
141
-
142
-
143
-
144
-
145
-
146
-
147
-
148
-
149
-
150
-
151
-
152
-
153
-
154
-
155
-
156
-
157
-
158
-
159
-
160
-
161
-
162
-
163
-
164
-
165
-
166
-
167
-
168
-
169
-
170
-
171
-
172
-
173
-
174
-
175
-
176
-
177
-
178
-
179
-
180
-
181
-
182
-
183
-
184
-
185
-
186
-
187
-
188
-
189
-
190
-
191
-
192
-
193
-
194
-
195
-
196
-
197
-
198
-
199
-
200
-
 201
201 -
 202
202 -
 203
203 -
 204
204 -
 205
205 -
 206
206 -
 207
207 -
 208
208 -
 209
209 -
 210
210 -
 211
211 -
 212
212 -
 213
213 -
 214
214 -
 215
215 -
 216
216 -
 217
217 -
 218
218 -
 219
219 -
 220
220 -
 221
221 -
222
-
223
-
224
-
225
-
226
-
227
-
228
-
229
-
230
-
231
-
232
-
233
-
234
-
235
-
236
-
237
-
238
-
239
-
240
-
241
-
242
-
243
-
244
-
245
-
246
-
247
-
248
-
249
-
250
-
251
-
252
-
253
-
254
-
255
-
256
-
257
-
258
-
259
-
260
-
261
-
262
-
263
-
264
-
265
-
266
-
267
-
268
-
269
-
270
-
271
-
272
-
273
-
274
-
275
-
276
-
277
-
278
-
279
-
280
-
281
-
282
-
283
-
284
-
285
-
286
-
287
-
288
-
289
-
290
-
291
-
292
-
293
-
294
-
295
-
296
-
297
-
298
-
299
-
300
-
301
-
302
-
303
-
304
-
305
-
306
-
307
-
308
-
309
-
310
-
311
-
312
-
313
-
314
-
315
-
316
-
317
-
318
-
319
-
320
-
321
-
322
-
323
-
324
-
325
-
326
-
327
-
328
-
329
-
330
-
331
-
332
-
333
-
334
-
335
-
336
-
337
-
338
-
339
-
340
-
341
-
342
-
343
-
344
-
345
-
346
 |
 |

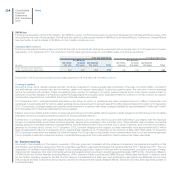
Notes
210 Consolidated
Financial
Statements
at 31 December
2012
Financial market risks
The Group is exposed to the risks from fluctuations in foreign currency exchange and interest rates, the commodity prices associated with business
operations, and, finally, the risk of a change in the price of certain shares.
The Group exposure to currency risk arises both in connection with the geographical distribution of the Group’s industrial activities compared to the markets
in which it sells its products, and in relation to the use of external borrowing denominated in foreign currencies.
The Group exposure to interest rate risk arises from the need to fund industrial and financial operating activities and the necessity to deploy surplus funds.
Changes in market interest rates may have the effect of either increasing or decreasing the Group’s net profit/(loss), thereby indirectly affecting the costs
and returns of financing and investing transactions.
The Group’s exposure to commodity price risk arises from the risk of changes occurring in the price of certain raw materials used in production. Changes
in the price of raw materials could have a significant effect on the Group’s results by indirectly affecting costs and product margins.
The Group regularly assesses its exposure to finance market risk and manages those risks through the use of derivative financial instruments in accordance
with its established risk management policies.
The Group’s policy permits derivatives to be used only for managing the exposure to fluctuations in exchange and interest rates as well as commodities
prices connected with future cash flows and assets and liabilities, and not for speculative purposes.
The Group utilises derivative financial instruments designated as fair value hedges, mainly to hedge:
the currency risk on financial instruments denominated in foreign currency;
the interest rate risk on fixed rate loans and borrowings.
The instruments used for these hedges are mainly currency swaps, and interest rate swaps and combined interest rate and currency financial instruments.
The Group uses derivative financial instruments as cash flow hedges for the purpose of pre-determining:
the exchange rate at which forecasted transactions denominated in foreign currencies will be accounted for;
the interest paid on borrowings, both to match the fixed interest received on loans (customer financing activity), and to achieve a pre-defined mix of
floating versus fixed rate funding structured loans;
the price of certain commodities.
The exchange rate exposure on forecasted commercial flows is hedged by currency swaps, forward contracts and currency options. Interest rate exposures
are usually hedged by interest rate swaps and, in limited cases, by forward rate agreements. Exposure to changes in the price of commodities is generally
hedged by using commodity swaps.
Counterparties to these agreements are major and diverse financial institutions.
Information on the fair value of derivative financial instruments held at the balance sheet date is provided in Note 21.