Chrysler 2012 Annual Report Download - page 164
Download and view the complete annual report
Please find page 164 of the 2012 Chrysler annual report below. You can navigate through the pages in the report by either clicking on the pages listed below, or by using the keyword search tool below to find specific information within the annual report.-
 1
1 -
2
-
3
-
4
-
5
-
6
-
7
-
8
-
9
-
10
-
11
-
12
-
13
-
14
-
15
-
16
-
17
-
18
-
19
-
20
-
21
-
22
-
23
-
24
-
25
-
26
-
27
-
28
-
29
-
30
-
31
-
32
-
33
-
34
-
35
-
36
-
37
-
38
-
39
-
40
-
41
-
42
-
43
-
44
-
45
-
46
-
47
-
48
-
49
-
50
-
51
-
52
-
53
-
54
-
55
-
56
-
57
-
58
-
59
-
60
-
61
-
62
-
63
-
64
-
65
-
66
-
67
-
68
-
69
-
70
-
71
-
72
-
73
-
74
-
75
-
76
-
77
-
78
-
79
-
80
-
81
-
82
-
83
-
84
-
85
-
86
-
87
-
88
-
89
-
90
-
91
-
92
-
93
-
94
-
95
-
96
-
97
-
98
-
99
-
100
-
101
-
102
-
103
-
104
-
105
-
106
-
107
-
108
-
109
-
110
-
111
-
112
-
113
-
114
-
115
-
116
-
117
-
118
-
119
-
120
-
121
-
122
-
123
-
124
-
125
-
126
-
127
-
128
-
129
-
130
-
131
-
132
-
133
-
134
-
135
-
136
-
137
-
138
-
139
-
140
-
141
-
142
-
143
-
144
-
145
-
146
-
147
-
148
-
149
-
150
-
151
-
152
-
153
-
 154
154 -
 155
155 -
 156
156 -
 157
157 -
 158
158 -
 159
159 -
 160
160 -
 161
161 -
 162
162 -
 163
163 -
 164
164 -
 165
165 -
 166
166 -
 167
167 -
 168
168 -
 169
169 -
 170
170 -
 171
171 -
 172
172 -
 173
173 -
 174
174 -
175
-
176
-
177
-
178
-
179
-
180
-
181
-
182
-
183
-
184
-
185
-
186
-
187
-
188
-
189
-
190
-
191
-
192
-
193
-
194
-
195
-
196
-
197
-
198
-
199
-
200
-
201
-
202
-
203
-
204
-
205
-
206
-
207
-
208
-
209
-
210
-
211
-
212
-
213
-
214
-
215
-
216
-
217
-
218
-
219
-
220
-
221
-
222
-
223
-
224
-
225
-
226
-
227
-
228
-
229
-
230
-
231
-
232
-
233
-
234
-
235
-
236
-
237
-
238
-
239
-
240
-
241
-
242
-
243
-
244
-
245
-
246
-
247
-
248
-
249
-
250
-
251
-
252
-
253
-
254
-
255
-
256
-
257
-
258
-
259
-
260
-
261
-
262
-
263
-
264
-
265
-
266
-
267
-
268
-
269
-
270
-
271
-
272
-
273
-
274
-
275
-
276
-
277
-
278
-
279
-
280
-
281
-
282
-
283
-
284
-
285
-
286
-
287
-
288
-
289
-
290
-
291
-
292
-
293
-
294
-
295
-
296
-
297
-
298
-
299
-
300
-
301
-
302
-
303
-
304
-
305
-
306
-
307
-
308
-
309
-
310
-
311
-
312
-
313
-
314
-
315
-
316
-
317
-
318
-
319
-
320
-
321
-
322
-
323
-
324
-
325
-
326
-
327
-
328
-
329
-
330
-
331
-
332
-
333
-
334
-
335
-
336
-
337
-
338
-
339
-
340
-
341
-
342
-
343
-
344
-
345
-
346
 |
 |
163
Consolidated
Financial Statements
at 31 December 2012
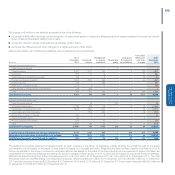
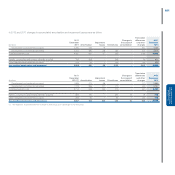
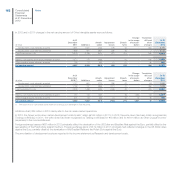
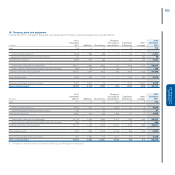
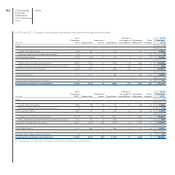
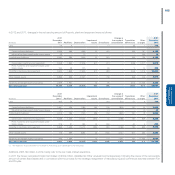
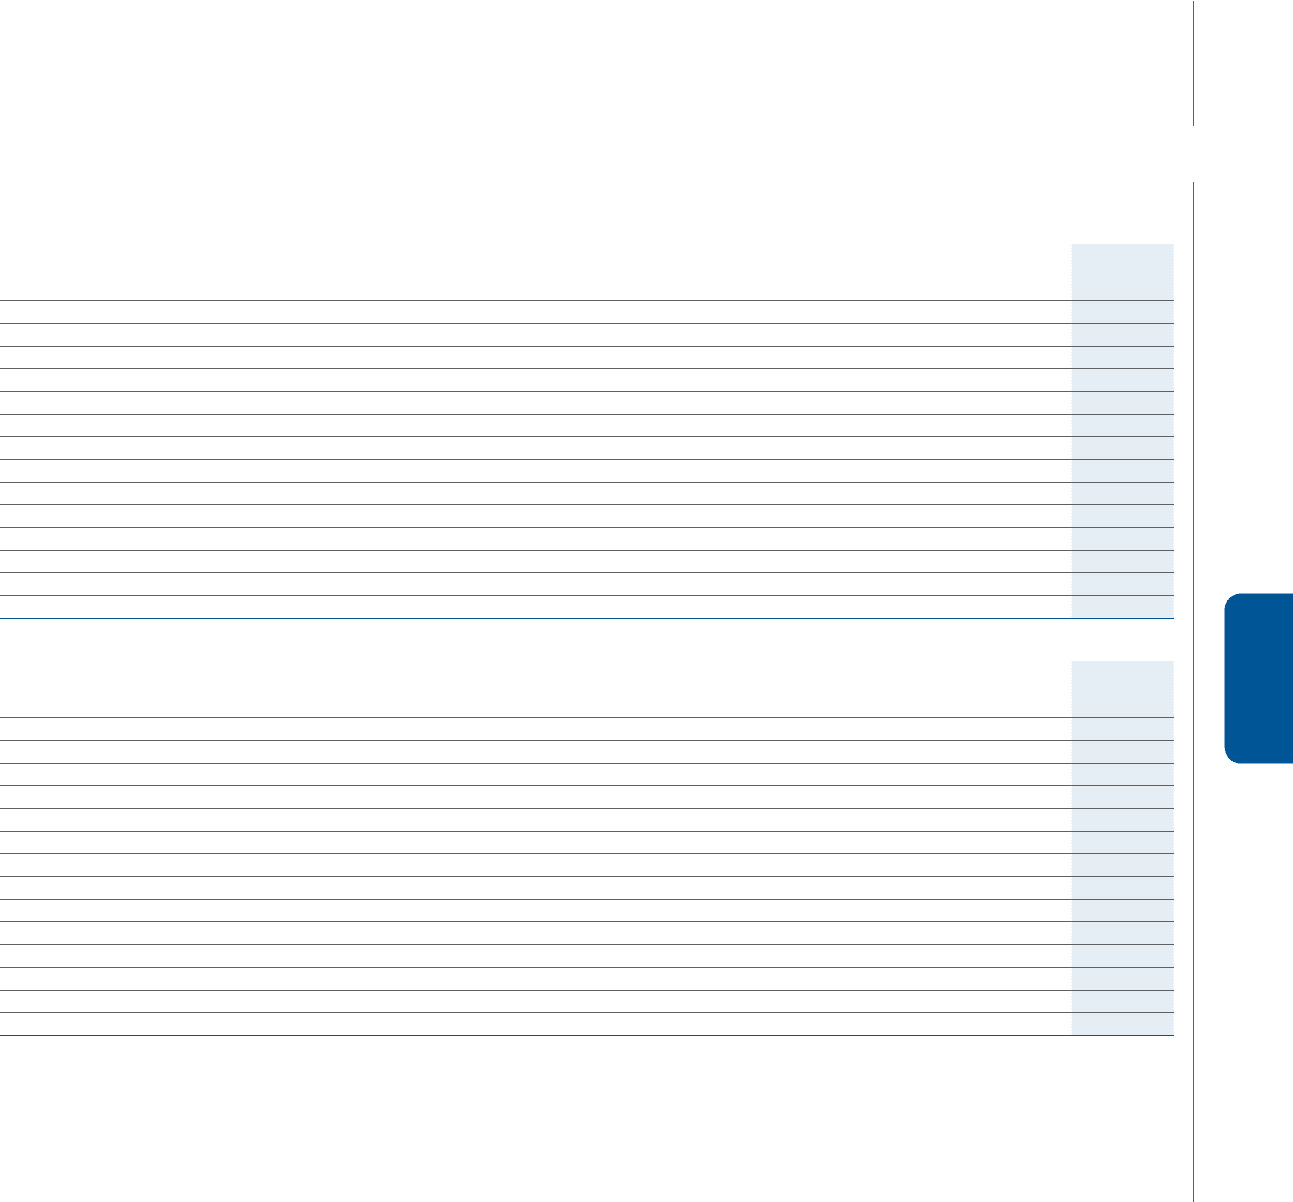
16. Property, plant and equipment
In 2012 and 2011, changes in the gross carrying amount of Property, plant and equipment were as follows:
(€ million)
At 31
December
2011 Additions Divestitures
Change in
the scope of
consolidation
Translation
differences
Other
changes
At 31
December
2012
Land 726 4 (7) - (8) 1 716
Owned industrial buildings 5,938 386 (33) 2 (70) 174 6,397
Industrial buildings leased under finance leases 57 - - - - (38) 19
Total Industrial buildings 5,995 386 (33) 2 (70) 136 6,416
Owned plant, machinery and equipment 28,211 1,830 (822) (12) (316) 1,023 29,914
Plant, machinery and equipment leased under finance leases 359 29 (3) (6) 3 - 382
Total Plant, machinery and equipment 28,570 1,859 (825) (18) (313) 1,023 30,296
Other tangible assets 5,403 939 (75) 2 (108) (89) 6,072
Advances and tangible assets in progress 2,679 1,961 (9) - (104) (1,254) 3,273
Gross carrying amount 43,373 5,149 (949) (14) (603) (183) 46,773
(€ million)
At 31
December
2010 (*) Additions Divestitures
Change in
the scope of
consolidation
Translation
differences
Other
changes
At 31
December
2011
Land 372 24 (10) 310 21 9 726
Owned industrial buildings 3,803 235 (27) 1,824 87 16 5,938
Industrial buildings leased under finance leases 60 - (2) - - (1) 57
Total Industrial buildings 3,863 235 (29) 1,824 87 15 5,995
Owned plant, machinery and equipment 23,738 1,456 (835) 3,201 (198) 849 28,211
Plant, machinery and equipment leased under finance leases 432 37 (111) - (3) 4 359
Total Plant, machinery and equipment 24,170 1,493 (946) 3,201 (201) 853 28,570
Other tangible assets 1,287 589 (194) 3,146 349 226 5,403
Advances and tangible assets in progress 961 1,584 (72) 1,201 122 (1,117) 2,679
Gross carrying amount 30,653 3,925 (1,251) 9,682 378 (14) 43,373
(*) The balances at 31 December 2010 relate to Fiat Group post demerger to Fiat Industrial.