Chrysler 2012 Annual Report Download - page 188
Download and view the complete annual report
Please find page 188 of the 2012 Chrysler annual report below. You can navigate through the pages in the report by either clicking on the pages listed below, or by using the keyword search tool below to find specific information within the annual report.-
 1
1 -
2
-
3
-
4
-
5
-
6
-
7
-
8
-
9
-
10
-
11
-
12
-
13
-
14
-
15
-
16
-
17
-
18
-
19
-
20
-
21
-
22
-
23
-
24
-
25
-
26
-
27
-
28
-
29
-
30
-
31
-
32
-
33
-
34
-
35
-
36
-
37
-
38
-
39
-
40
-
41
-
42
-
43
-
44
-
45
-
46
-
47
-
48
-
49
-
50
-
51
-
52
-
53
-
54
-
55
-
56
-
57
-
58
-
59
-
60
-
61
-
62
-
63
-
64
-
65
-
66
-
67
-
68
-
69
-
70
-
71
-
72
-
73
-
74
-
75
-
76
-
77
-
78
-
79
-
80
-
81
-
82
-
83
-
84
-
85
-
86
-
87
-
88
-
89
-
90
-
91
-
92
-
93
-
94
-
95
-
96
-
97
-
98
-
99
-
100
-
101
-
102
-
103
-
104
-
105
-
106
-
107
-
108
-
109
-
110
-
111
-
112
-
113
-
114
-
115
-
116
-
117
-
118
-
119
-
120
-
121
-
122
-
123
-
124
-
125
-
126
-
127
-
128
-
129
-
130
-
131
-
132
-
133
-
134
-
135
-
136
-
137
-
138
-
139
-
140
-
141
-
142
-
143
-
144
-
145
-
146
-
147
-
148
-
149
-
150
-
151
-
152
-
153
-
154
-
155
-
156
-
157
-
158
-
159
-
160
-
161
-
162
-
163
-
164
-
165
-
166
-
167
-
168
-
169
-
170
-
171
-
172
-
173
-
174
-
175
-
176
-
177
-
 178
178 -
 179
179 -
 180
180 -
 181
181 -
 182
182 -
 183
183 -
 184
184 -
 185
185 -
 186
186 -
 187
187 -
 188
188 -
 189
189 -
 190
190 -
 191
191 -
 192
192 -
 193
193 -
 194
194 -
 195
195 -
 196
196 -
 197
197 -
 198
198 -
199
-
200
-
201
-
202
-
203
-
204
-
205
-
206
-
207
-
208
-
209
-
210
-
211
-
212
-
213
-
214
-
215
-
216
-
217
-
218
-
219
-
220
-
221
-
222
-
223
-
224
-
225
-
226
-
227
-
228
-
229
-
230
-
231
-
232
-
233
-
234
-
235
-
236
-
237
-
238
-
239
-
240
-
241
-
242
-
243
-
244
-
245
-
246
-
247
-
248
-
249
-
250
-
251
-
252
-
253
-
254
-
255
-
256
-
257
-
258
-
259
-
260
-
261
-
262
-
263
-
264
-
265
-
266
-
267
-
268
-
269
-
270
-
271
-
272
-
273
-
274
-
275
-
276
-
277
-
278
-
279
-
280
-
281
-
282
-
283
-
284
-
285
-
286
-
287
-
288
-
289
-
290
-
291
-
292
-
293
-
294
-
295
-
296
-
297
-
298
-
299
-
300
-
301
-
302
-
303
-
304
-
305
-
306
-
307
-
308
-
309
-
310
-
311
-
312
-
313
-
314
-
315
-
316
-
317
-
318
-
319
-
320
-
321
-
322
-
323
-
324
-
325
-
326
-
327
-
328
-
329
-
330
-
331
-
332
-
333
-
334
-
335
-
336
-
337
-
338
-
339
-
340
-
341
-
342
-
343
-
344
-
345
-
346
 |
 |
187
Consolidated
Financial Statements
at 31 December 2012
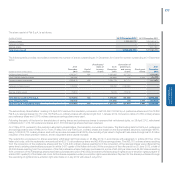
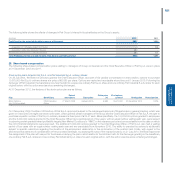
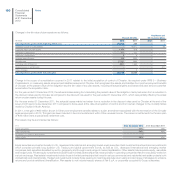
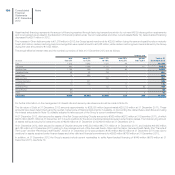
In 2012 and in 2011 changes in Other provisions for employees and in Other long-term employee benefits were as follows:
(€ million)
At 31 December
2011 Provision
Utilisation and
release to income
Change in the
scope of
consolidation
Exchange rate
differences and
other differences
At 31 December
2012
Other provisions for employees 1,006 847 (837) - (110) 906
Other long-term employee benefits 297 52 (25) - 2 326
Total 1,303 899 (862) - (108) 1,232
(€ million)
At 31 December
2010 (*) Provision
Utilisation and
release to income
Change in the
scope of
consolidation
Exchange rate
differences and
other differences
At 31 December
2011
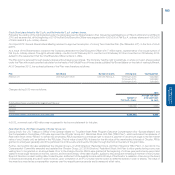
Other provisions for employees 491 566 (557) 351 155 1,006
Other long-term employee benefits 124 17 (33) 173 16 297
Total 615 583 (590) 524 171 1,303
(*) The balances at 31 December 2010 relate to Fiat Group post demerger to Fiat Industrial.
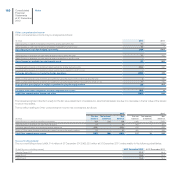
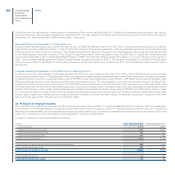
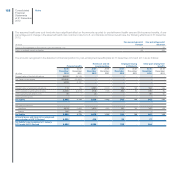
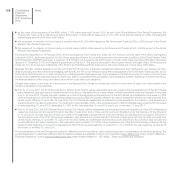
The main assumptions used to determine the net liability for the pension benefits were as follows:
At 31 December 2012 At 31 December 2011
(In %) USA Canada UK USA Canada UK
Discount rate 4.0 3.9 4.6 5.0 4.1 5.1
Future salary increase rate 3.0 3.5 3.0 3.8 3.5 2.7
Inflation rate n/a n/a 3.0 n/a n/a 2.7
Expected long term rate of return on plan assets 7.5 7.0 7.0 7.5 7.0 7.0
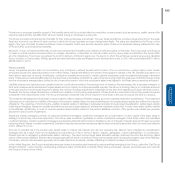
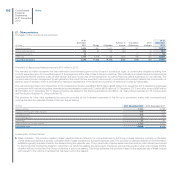
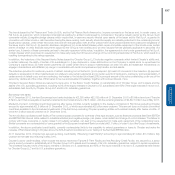
The main assumptions used to determine the net liability for other post-employment benefits were as follows:
At 31 December 2012 At 31 December 2011
(In %) USA Canada Italy USA Canada Italy
Discount rate 4.1 3.9 3.4 5.1 4.2 4.4
Future salary increase rate n/a 2.7 2.5 n/a 2.7 3.2
Inflation rate n/a n/a 2.0 n/a n/a 2.0
Weighted average ultimate healthcare cost trend rate 8.0 3.7 n/a 8.5 3.7 n/a
The discount rates are used in measuring the obligation and the interest component of net period cost. The Group selects these rates on the basis of the
yields on high-quality fixed income investments for which the timing and amounts of payments match the timing and amounts of the projected pension and
other post-employment plan.
The expected long-term rate of return on plan assets assumption is developed using a consistent approach across all plans. This approach primarily
considers various inputs from a range of advisors for long-term capital market returns, inflation, bond yields and other variables, adjusted for specific aspects
of our investment strategy.
The annual rate of increase in the per capita cost of covered U.S. health care benefits assumed for 2012 was 8.0%. The annual rate was assumed to
decrease gradually to 5.0% after 2017 and remain at that level thereafter. The annual rate of increase in the per capita cost of covered Canadian health care
benefits assumed for 2012 was 3.7%. The annual rate was assumed to remain at 3.7% thereafter.