Chrysler 2012 Annual Report Download - page 94
Download and view the complete annual report
Please find page 94 of the 2012 Chrysler annual report below. You can navigate through the pages in the report by either clicking on the pages listed below, or by using the keyword search tool below to find specific information within the annual report.-
 1
1 -
2
-
3
-
4
-
5
-
6
-
7
-
8
-
9
-
10
-
11
-
12
-
13
-
14
-
15
-
16
-
17
-
18
-
19
-
20
-
21
-
22
-
23
-
24
-
25
-
26
-
27
-
28
-
29
-
30
-
31
-
32
-
33
-
34
-
35
-
36
-
37
-
38
-
39
-
40
-
41
-
42
-
43
-
44
-
45
-
46
-
47
-
48
-
49
-
50
-
51
-
52
-
53
-
54
-
55
-
56
-
57
-
58
-
59
-
60
-
61
-
62
-
63
-
64
-
65
-
66
-
67
-
68
-
69
-
70
-
71
-
72
-
73
-
74
-
75
-
76
-
77
-
78
-
79
-
80
-
81
-
82
-
83
-
 84
84 -
 85
85 -
 86
86 -
 87
87 -
 88
88 -
 89
89 -
 90
90 -
 91
91 -
 92
92 -
 93
93 -
 94
94 -
 95
95 -
 96
96 -
 97
97 -
 98
98 -
 99
99 -
 100
100 -
 101
101 -
 102
102 -
 103
103 -
 104
104 -
105
-
106
-
107
-
108
-
109
-
110
-
111
-
112
-
113
-
114
-
115
-
116
-
117
-
118
-
119
-
120
-
121
-
122
-
123
-
124
-
125
-
126
-
127
-
128
-
129
-
130
-
131
-
132
-
133
-
134
-
135
-
136
-
137
-
138
-
139
-
140
-
141
-
142
-
143
-
144
-
145
-
146
-
147
-
148
-
149
-
150
-
151
-
152
-
153
-
154
-
155
-
156
-
157
-
158
-
159
-
160
-
161
-
162
-
163
-
164
-
165
-
166
-
167
-
168
-
169
-
170
-
171
-
172
-
173
-
174
-
175
-
176
-
177
-
178
-
179
-
180
-
181
-
182
-
183
-
184
-
185
-
186
-
187
-
188
-
189
-
190
-
191
-
192
-
193
-
194
-
195
-
196
-
197
-
198
-
199
-
200
-
201
-
202
-
203
-
204
-
205
-
206
-
207
-
208
-
209
-
210
-
211
-
212
-
213
-
214
-
215
-
216
-
217
-
218
-
219
-
220
-
221
-
222
-
223
-
224
-
225
-
226
-
227
-
228
-
229
-
230
-
231
-
232
-
233
-
234
-
235
-
236
-
237
-
238
-
239
-
240
-
241
-
242
-
243
-
244
-
245
-
246
-
247
-
248
-
249
-
250
-
251
-
252
-
253
-
254
-
255
-
256
-
257
-
258
-
259
-
260
-
261
-
262
-
263
-
264
-
265
-
266
-
267
-
268
-
269
-
270
-
271
-
272
-
273
-
274
-
275
-
276
-
277
-
278
-
279
-
280
-
281
-
282
-
283
-
284
-
285
-
286
-
287
-
288
-
289
-
290
-
291
-
292
-
293
-
294
-
295
-
296
-
297
-
298
-
299
-
300
-
301
-
302
-
303
-
304
-
305
-
306
-
307
-
308
-
309
-
310
-
311
-
312
-
313
-
314
-
315
-
316
-
317
-
318
-
319
-
320
-
321
-
322
-
323
-
324
-
325
-
326
-
327
-
328
-
329
-
330
-
331
-
332
-
333
-
334
-
335
-
336
-
337
-
338
-
339
-
340
-
341
-
342
-
343
-
344
-
345
-
346
 |
 |

93
Report on Operations
The Group seeks to reduce the quantities of hazardous waste generated. In 2012, the Group successfully reduced hazardous waste
by 20.3% over 2011 and 34.7% over 2010. Those results were attributable to a number of initiatives implemented during the year, in
particular at the Teksid foundry at Ingrandes-sur-Vienne (France), where an advanced sand regeneration plant was installed.
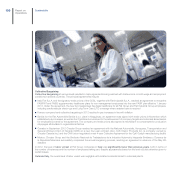
Logistics
Efficient and environmentally sustainable logistics processes are key factors in value creation.
In addition to minimizing cost and optimizing transport flows, the Group has also been working to reduce logistics-related emissions
throughout the supply chain and minimize the use of non-reusable packaging. In 2010, the Group published the Green Logistics
Principles as part of a process to coordinate the approach and methods of interaction with logistics partners. The Principles provide
guidelines on reducing environmental impacts with a focus on four main areas: low-emissions transport, intermodal transport solutions,
reduced use of packaging and protective materials, and optimized use of available transport capacity.
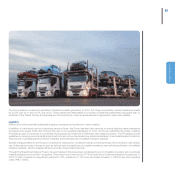
Specific measures taken by the Group to contribute to reducing CO2 emissions include: promoting the use of low-emission road vehicle;
use of alternative modes of transport such as rail and sea; increased use of reusable containers; and optimizing utilization of available
transport capacity, which increases efficiency and also lowers shipping costs.
Through the Streamlined Delivery Project, inbound transport flows have been contracted to a pool of logistics providers who coordinate
material pickups from a number of suppliers. This project now covers around 71% of total inbound volumes shipped in Europe and, in
2012 for FGA, it resulted in a significant reduction in CO2 emissions (-7,135 tons), kilometers traveled (-7,180,000 km) and operating
costs (-€8.7 million).