Chrysler 2012 Annual Report Download - page 172
Download and view the complete annual report
Please find page 172 of the 2012 Chrysler annual report below. You can navigate through the pages in the report by either clicking on the pages listed below, or by using the keyword search tool below to find specific information within the annual report.-
 1
1 -
2
-
3
-
4
-
5
-
6
-
7
-
8
-
9
-
10
-
11
-
12
-
13
-
14
-
15
-
16
-
17
-
18
-
19
-
20
-
21
-
22
-
23
-
24
-
25
-
26
-
27
-
28
-
29
-
30
-
31
-
32
-
33
-
34
-
35
-
36
-
37
-
38
-
39
-
40
-
41
-
42
-
43
-
44
-
45
-
46
-
47
-
48
-
49
-
50
-
51
-
52
-
53
-
54
-
55
-
56
-
57
-
58
-
59
-
60
-
61
-
62
-
63
-
64
-
65
-
66
-
67
-
68
-
69
-
70
-
71
-
72
-
73
-
74
-
75
-
76
-
77
-
78
-
79
-
80
-
81
-
82
-
83
-
84
-
85
-
86
-
87
-
88
-
89
-
90
-
91
-
92
-
93
-
94
-
95
-
96
-
97
-
98
-
99
-
100
-
101
-
102
-
103
-
104
-
105
-
106
-
107
-
108
-
109
-
110
-
111
-
112
-
113
-
114
-
115
-
116
-
117
-
118
-
119
-
120
-
121
-
122
-
123
-
124
-
125
-
126
-
127
-
128
-
129
-
130
-
131
-
132
-
133
-
134
-
135
-
136
-
137
-
138
-
139
-
140
-
141
-
142
-
143
-
144
-
145
-
146
-
147
-
148
-
149
-
150
-
151
-
152
-
153
-
154
-
155
-
156
-
157
-
158
-
159
-
160
-
161
-
 162
162 -
 163
163 -
 164
164 -
 165
165 -
 166
166 -
 167
167 -
 168
168 -
 169
169 -
 170
170 -
 171
171 -
 172
172 -
 173
173 -
 174
174 -
 175
175 -
 176
176 -
 177
177 -
 178
178 -
 179
179 -
 180
180 -
 181
181 -
 182
182 -
183
-
184
-
185
-
186
-
187
-
188
-
189
-
190
-
191
-
192
-
193
-
194
-
195
-
196
-
197
-
198
-
199
-
200
-
201
-
202
-
203
-
204
-
205
-
206
-
207
-
208
-
209
-
210
-
211
-
212
-
213
-
214
-
215
-
216
-
217
-
218
-
219
-
220
-
221
-
222
-
223
-
224
-
225
-
226
-
227
-
228
-
229
-
230
-
231
-
232
-
233
-
234
-
235
-
236
-
237
-
238
-
239
-
240
-
241
-
242
-
243
-
244
-
245
-
246
-
247
-
248
-
249
-
250
-
251
-
252
-
253
-
254
-
255
-
256
-
257
-
258
-
259
-
260
-
261
-
262
-
263
-
264
-
265
-
266
-
267
-
268
-
269
-
270
-
271
-
272
-
273
-
274
-
275
-
276
-
277
-
278
-
279
-
280
-
281
-
282
-
283
-
284
-
285
-
286
-
287
-
288
-
289
-
290
-
291
-
292
-
293
-
294
-
295
-
296
-
297
-
298
-
299
-
300
-
301
-
302
-
303
-
304
-
305
-
306
-
307
-
308
-
309
-
310
-
311
-
312
-
313
-
314
-
315
-
316
-
317
-
318
-
319
-
320
-
321
-
322
-
323
-
324
-
325
-
326
-
327
-
328
-
329
-
330
-
331
-
332
-
333
-
334
-
335
-
336
-
337
-
338
-
339
-
340
-
341
-
342
-
343
-
344
-
345
-
346
 |
 |

171
Consolidated
Financial Statements
at 31 December 2012
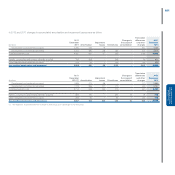
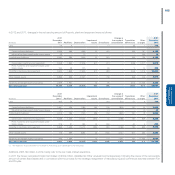
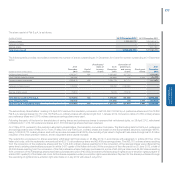
Finance lease receivables refer to vehicles leased out under finance lease arrangements, mainly by the Performance and Luxury Brands operating segment.
The interest rate implicit in the lease is determined at the contract date for the whole of the lease term and is in line with market rates. This item may be
analysed as follows, gross of an allowance of €5 million at 31 December 2012 (€9 million at 31 December 2011):
At 31 December 2012 At 31 December 2011
(€ million)
due
within
one year
due between
one and
five years
due
beyond
five years Total
due
within
one year
due between
one and
five years
due
beyond
five years Total
Receivables for future minimum lease payments 122 233 - 355 110 216 9 335
Less: unrealised interest income (11) (17) - (28) (5) (11) - (16)
Present value of future minimum lease payments 111 216 - 327 105 205 9 319
No contingent rents were recognised as finance leases during 2012 or 2011 and unguaranteed residual values at 31 December 2012 and 2011 are not
significant.
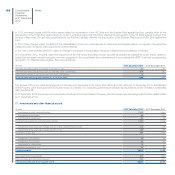
Receivables for dealer financing are typically generated by sales of vehicles and are generally managed under dealer network financing programs as a
component of the portfolio of the financial services companies. These receivables are interest bearing, with the exception of an initial limited, non-interest
bearing period. The contractual terms governing the relationships with the dealer networks vary from country to country, although payment terms range
from two to six months.
Financial receivables from jointly controlled financial services companies include current financial receivables due from the FGA Capital group.
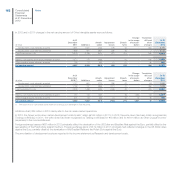
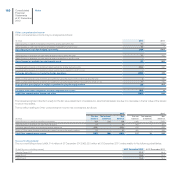
The fair value of receivables from financing activities at 31 December 2012 amounts to approximately €3,724 million (€3,956 million at 31 December 2011).
These fair values have been calculated using a discounted cash flow method based on the following discount rates, adjusted where necessary to take
account of spread applied in various reference markets on receivables with similar characteristic.
(In %) EUR USD GBP CAD AUD BRL PLN
Interest rate for six months 0.32 0.30 0.67 1.30 2.90 7.08 3.79
Interest rate for one year 0.33 0.32 0.67 1.33 2.79 7.12 3.41
Interest rate for five years 0.77 0.85 1.02 1.71 3.31 8.15 3.33
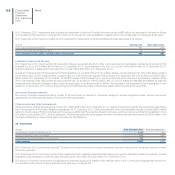
Other current assets
At 31 December 2012, Other current assets mainly consist of Other tax receivables for VAT and other indirect taxes of €871 million (€848 million at
31 December 2011), Receivables from employees of €76 million (€51 million at 31 December 2011) and Accrued income and prepaid expenses of
€387 million (€378 million at 31 December 2011).
The carrying amount of Other current assets is considered to be in line with fair value.
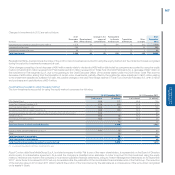
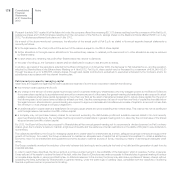
Transfer of financial assets
The Group transfers certain of its financial, trade and tax receivables, mainly through factoring transactions. Factoring transactions may be either with
recourse or without recourse; certain without recourse transfers include deferred payment clauses (for example, when the payment by the factor of a minor
part of the purchase price is dependent on the total amount collected from the receivables), requiring first loss cover, meaning that the transferor takes
priority participation in the losses, or require a significant exposure to the cash flows arising from the transferred receivables to be retained. These types of
transactions do not comply with the requirements of IAS 39 for the derecognition of the assets since the risks and rewards connected with collection are
not transferred, and accordingly the Group continues to recognise the receivables transferred by this means in its balance sheet and recognises a financial
liability of the same amount in its consolidated financial statements under Asset-backed financing (Note 28). The gains and losses arising from the transfer
of these assets are only recognised when the assets are derecognised in the Group’s balance sheet.