Chrysler 2012 Annual Report Download - page 48
Download and view the complete annual report
Please find page 48 of the 2012 Chrysler annual report below. You can navigate through the pages in the report by either clicking on the pages listed below, or by using the keyword search tool below to find specific information within the annual report.-
 1
1 -
2
-
3
-
4
-
5
-
6
-
7
-
8
-
9
-
10
-
11
-
12
-
13
-
14
-
15
-
16
-
17
-
18
-
19
-
20
-
21
-
22
-
23
-
24
-
25
-
26
-
27
-
28
-
29
-
30
-
31
-
32
-
33
-
34
-
35
-
36
-
37
-
 38
38 -
 39
39 -
 40
40 -
 41
41 -
 42
42 -
 43
43 -
 44
44 -
 45
45 -
 46
46 -
 47
47 -
 48
48 -
 49
49 -
 50
50 -
 51
51 -
 52
52 -
 53
53 -
 54
54 -
 55
55 -
 56
56 -
 57
57 -
 58
58 -
59
-
60
-
61
-
62
-
63
-
64
-
65
-
66
-
67
-
68
-
69
-
70
-
71
-
72
-
73
-
74
-
75
-
76
-
77
-
78
-
79
-
80
-
81
-
82
-
83
-
84
-
85
-
86
-
87
-
88
-
89
-
90
-
91
-
92
-
93
-
94
-
95
-
96
-
97
-
98
-
99
-
100
-
101
-
102
-
103
-
104
-
105
-
106
-
107
-
108
-
109
-
110
-
111
-
112
-
113
-
114
-
115
-
116
-
117
-
118
-
119
-
120
-
121
-
122
-
123
-
124
-
125
-
126
-
127
-
128
-
129
-
130
-
131
-
132
-
133
-
134
-
135
-
136
-
137
-
138
-
139
-
140
-
141
-
142
-
143
-
144
-
145
-
146
-
147
-
148
-
149
-
150
-
151
-
152
-
153
-
154
-
155
-
156
-
157
-
158
-
159
-
160
-
161
-
162
-
163
-
164
-
165
-
166
-
167
-
168
-
169
-
170
-
171
-
172
-
173
-
174
-
175
-
176
-
177
-
178
-
179
-
180
-
181
-
182
-
183
-
184
-
185
-
186
-
187
-
188
-
189
-
190
-
191
-
192
-
193
-
194
-
195
-
196
-
197
-
198
-
199
-
200
-
201
-
202
-
203
-
204
-
205
-
206
-
207
-
208
-
209
-
210
-
211
-
212
-
213
-
214
-
215
-
216
-
217
-
218
-
219
-
220
-
221
-
222
-
223
-
224
-
225
-
226
-
227
-
228
-
229
-
230
-
231
-
232
-
233
-
234
-
235
-
236
-
237
-
238
-
239
-
240
-
241
-
242
-
243
-
244
-
245
-
246
-
247
-
248
-
249
-
250
-
251
-
252
-
253
-
254
-
255
-
256
-
257
-
258
-
259
-
260
-
261
-
262
-
263
-
264
-
265
-
266
-
267
-
268
-
269
-
270
-
271
-
272
-
273
-
274
-
275
-
276
-
277
-
278
-
279
-
280
-
281
-
282
-
283
-
284
-
285
-
286
-
287
-
288
-
289
-
290
-
291
-
292
-
293
-
294
-
295
-
296
-
297
-
298
-
299
-
300
-
301
-
302
-
303
-
304
-
305
-
306
-
307
-
308
-
309
-
310
-
311
-
312
-
313
-
314
-
315
-
316
-
317
-
318
-
319
-
320
-
321
-
322
-
323
-
324
-
325
-
326
-
327
-
328
-
329
-
330
-
331
-
332
-
333
-
334
-
335
-
336
-
337
-
338
-
339
-
340
-
341
-
342
-
343
-
344
-
345
-
346
 |
 |

47
Report on Operations
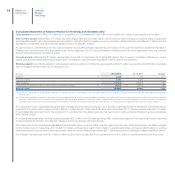
Income from investments totaled €107 million down from €131 million for 2011. The figure primarily relates
to the Group’s share of the profit or loss of investees recognized using the equity method (€94 million in 2012 vs.
€146 million in 2011). The item consisted of the following: investments in EMEA €160 million (€160 million in 2011);
investment in RCS MediaGroup -€68 million (-€2 million in 2011); investments in the Components sector €2 million
(-€15 million in 2011); other €13 million (-€12million in 2011).
Net losses on the disposal of investments totaled €91 million (net gains of €21 million in 2011) and related
to the write-down of the investment in the SevelNord joint venture.
Restructuring costs totaled €15 million for 2012 and mainly consisted of costs recognized for the EMEA
region (€43 million), the Components sector (€7 million) and other companies (€13 million), net of the reversal
of €48 million in restructuring charges previously recognized for the NAFTA region.
Other unusual expense totaled €138 million and primarily included provisions for disputes related to activities
terminated in prior years and costs related to the resolution of the SevelNord JV and to the rationalization of
relationships with certain suppliers. In 2011, the Group reported other unusual income (net) of €1,025 million.
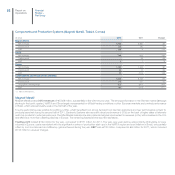
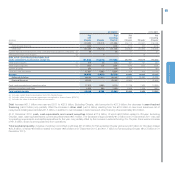
Unusual income totaled €2,100 million, of which €2,017 million related to the fair value re-measurement of
the 30% ownership interest held in Chrysler prior to the acquisition of control and of the right to receive an
additional 5% ownership interest following achievement by Chrysler of the third Performance Event (which
occurred in early January 2012). Unusual expense totaled €1,075 million, of which €855 million excluding
Chrysler was largely attributable to the impact on Fiat’s businesses of the strategic realignment with Chrysler’s
manufacturing and commercial activities, and to one-off charges mainly related to the realignment of certain
minor activities of the Group.
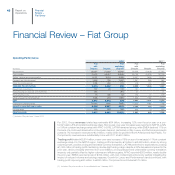
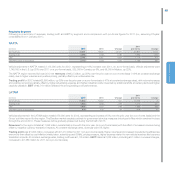
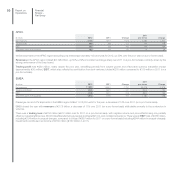
EBIT was €3,677 million. Net of unusual items, there was a year-over-year increase of 17% on a pro-forma
basis. For mass-market brands, EBIT by region was as follows: NAFTA €2,741 million, LATAM €1,032 million,
and APAC €255 million. EMEA reported a €738 million loss (€544 million net of unusual items), compared with
an €897 million loss in 2011 (€353 million net of unusual items).
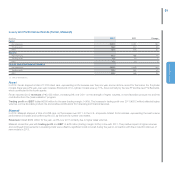
Net financial expense totaled €1,641 million. Excluding Chrysler, net financial expense was €825 million,
compared with €796 million for 2011. Net of the impact of the mark-to-market of the Fiat stock option-related
equity swaps (a €34 million gain for 2012 and €108 million loss for 2011), net financial expense increased by
€171 million, mainly reflecting higher net debt levels.
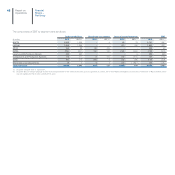
Profit before taxes was €2,036 million. Excluding Chrysler, there was a loss of €621 million, compared
with a profit of €1,470 million in 2011. Net of unusual items, the loss was €360 million, compared with a profit
of €381 million in 2011; the €741 million reduction reflects a €692 million decrease in trading profit and a
€29 million increase in net financial expense.
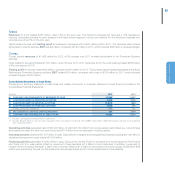
Income taxes totaled €625 million. Excluding Chrysler, income taxes were €420 million and related primarily
to the taxable income of companies operating outside Europe and employment-related taxes in Italy.
Net profit was €1,411 million. Excluding Chrysler, there was a net loss of €1,041 million, compared with
a €1,006 million profit for 2011; excluding unusual items, the loss totaled €780 million compared with a
€106 million loss for 2011.
Profit attributable to owners of the parent amounted to €348 million (€1,334 million in 2011).