Chrysler 2012 Annual Report Download - page 54
Download and view the complete annual report
Please find page 54 of the 2012 Chrysler annual report below. You can navigate through the pages in the report by either clicking on the pages listed below, or by using the keyword search tool below to find specific information within the annual report.-
 1
1 -
2
-
3
-
4
-
5
-
6
-
7
-
8
-
9
-
10
-
11
-
12
-
13
-
14
-
15
-
16
-
17
-
18
-
19
-
20
-
21
-
22
-
23
-
24
-
25
-
26
-
27
-
28
-
29
-
30
-
31
-
32
-
33
-
34
-
35
-
36
-
37
-
38
-
39
-
40
-
41
-
42
-
43
-
 44
44 -
 45
45 -
 46
46 -
 47
47 -
 48
48 -
 49
49 -
 50
50 -
 51
51 -
 52
52 -
 53
53 -
 54
54 -
 55
55 -
 56
56 -
 57
57 -
 58
58 -
 59
59 -
 60
60 -
 61
61 -
 62
62 -
 63
63 -
 64
64 -
65
-
66
-
67
-
68
-
69
-
70
-
71
-
72
-
73
-
74
-
75
-
76
-
77
-
78
-
79
-
80
-
81
-
82
-
83
-
84
-
85
-
86
-
87
-
88
-
89
-
90
-
91
-
92
-
93
-
94
-
95
-
96
-
97
-
98
-
99
-
100
-
101
-
102
-
103
-
104
-
105
-
106
-
107
-
108
-
109
-
110
-
111
-
112
-
113
-
114
-
115
-
116
-
117
-
118
-
119
-
120
-
121
-
122
-
123
-
124
-
125
-
126
-
127
-
128
-
129
-
130
-
131
-
132
-
133
-
134
-
135
-
136
-
137
-
138
-
139
-
140
-
141
-
142
-
143
-
144
-
145
-
146
-
147
-
148
-
149
-
150
-
151
-
152
-
153
-
154
-
155
-
156
-
157
-
158
-
159
-
160
-
161
-
162
-
163
-
164
-
165
-
166
-
167
-
168
-
169
-
170
-
171
-
172
-
173
-
174
-
175
-
176
-
177
-
178
-
179
-
180
-
181
-
182
-
183
-
184
-
185
-
186
-
187
-
188
-
189
-
190
-
191
-
192
-
193
-
194
-
195
-
196
-
197
-
198
-
199
-
200
-
201
-
202
-
203
-
204
-
205
-
206
-
207
-
208
-
209
-
210
-
211
-
212
-
213
-
214
-
215
-
216
-
217
-
218
-
219
-
220
-
221
-
222
-
223
-
224
-
225
-
226
-
227
-
228
-
229
-
230
-
231
-
232
-
233
-
234
-
235
-
236
-
237
-
238
-
239
-
240
-
241
-
242
-
243
-
244
-
245
-
246
-
247
-
248
-
249
-
250
-
251
-
252
-
253
-
254
-
255
-
256
-
257
-
258
-
259
-
260
-
261
-
262
-
263
-
264
-
265
-
266
-
267
-
268
-
269
-
270
-
271
-
272
-
273
-
274
-
275
-
276
-
277
-
278
-
279
-
280
-
281
-
282
-
283
-
284
-
285
-
286
-
287
-
288
-
289
-
290
-
291
-
292
-
293
-
294
-
295
-
296
-
297
-
298
-
299
-
300
-
301
-
302
-
303
-
304
-
305
-
306
-
307
-
308
-
309
-
310
-
311
-
312
-
313
-
314
-
315
-
316
-
317
-
318
-
319
-
320
-
321
-
322
-
323
-
324
-
325
-
326
-
327
-
328
-
329
-
330
-
331
-
332
-
333
-
334
-
335
-
336
-
337
-
338
-
339
-
340
-
341
-
342
-
343
-
344
-
345
-
346
 |
 |

53
Report on Operations
Teksid
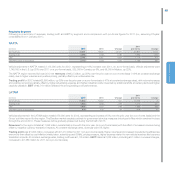
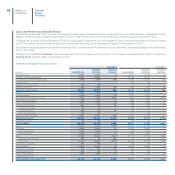
Revenues for 2012 totaled €780 million, down 15% on the prior year. The Cast Iron business unit recorded a 16% decrease in
volumes, attributable primarily to lower demand in the heavy vehicle segment in most core markets. For the Aluminum business unit,
volumes were down 5% on the prior year.
Teksid closed the year with trading result at breakeven, compared with a €26 million profit in 2011. The decrease was primarily
attributable to volume declines. EBIT was €4 million, compared with €1 million in 2011, which included €28 million in unusual charges.
Comau
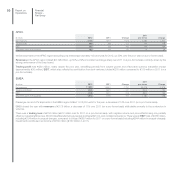
Comau posted revenues of €1,482 million for 2012, a 6% increase over 2011 primarily attributable to the Powertrain Systems
activities.
Order intake for the period totaled €1,557 million, down 3% over 2011. At 31 December 2012, the order backlog totaled €876 million
(+5% over year-end 2011).
Trading profit for the year totaled €36 million, compared to €10 million for 2011. The increase was principally attributable to the Body
Welding and Powertrain Systems activities. EBIT totaled €33 million, compared with a loss of €120 million for 2011, which included
unusual charges of €130 million.
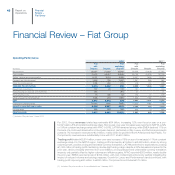
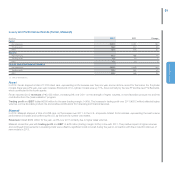
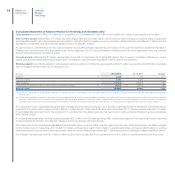
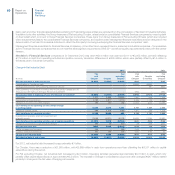
Consolidated Statement of Cash Flows
Following is a summary statement of cash flows and related comments. A complete statement of cash flows is provided in the
Consolidated Financial Statements.
(€ million) 2012 2011 (*)
A) CASH AND CASH EQUIVALENTS AT BEGINNING OF YEAR 17,526 11,967
B) CASH FROM/(USED IN) OPERATING ACTIVITIES 6,444 5,195
C) CASH FROM/(USED IN) INVESTING ACTIVITIES (7,537) (858) (**)
D) CASH FROM/(USED IN) FINANCING ACTIVITIES 1,643 632
Currency translation differences (419) 590
E) NET CHANGE IN CASH AND CASH EQUIVALENTS 131 5,559
F) CASH AND CASH EQUIVALENTS AT END OF YEAR 17,657 17,526
(*) Includes consolidation of Chrysler from 1 June 2011.
(**) Includes €5,624 million in cash and cash equivalents from consolidation of Chrysler, net of €881 million (USD 1,268 million) paid to Chrysler for an additional
16% ownership interest.
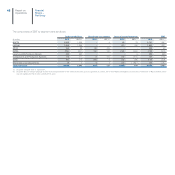
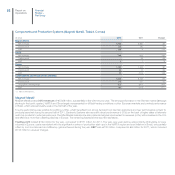
Operating activities generated cash of €6,444 million, of which €5,730 million from income-related cash inflows (i.e., net profit plus
amortization and sals and other non-cash items) and €714 million from the decrease in working capital.
Investing activities absorbed €7,537 million in cash. Expenditure on tangible and intangible fixed assets (including €2,138 million in
capitalized development costs) totaled €7,534 million.
Financing activities generated €1,643 million in cash. During 2012, the €2.5 billion in proceeds from bonds issued by Fiat Finance
and Trade Ltd. S.A. was partially offset by repayment of approximately €1.5 billion in bond maturities. In addition, repayment of
medium-term borrowing totaling €1.5 billion was more than offset by €1.9 billion in new medium-term borrowings. Dividends of €58
million were paid during the year (on Fiat preference and savings shares and to minority shareholders of subsidiaries).