Chrysler 2012 Annual Report Download - page 153
Download and view the complete annual report
Please find page 153 of the 2012 Chrysler annual report below. You can navigate through the pages in the report by either clicking on the pages listed below, or by using the keyword search tool below to find specific information within the annual report.-
 1
1 -
2
-
3
-
4
-
5
-
6
-
7
-
8
-
9
-
10
-
11
-
12
-
13
-
14
-
15
-
16
-
17
-
18
-
19
-
20
-
21
-
22
-
23
-
24
-
25
-
26
-
27
-
28
-
29
-
30
-
31
-
32
-
33
-
34
-
35
-
36
-
37
-
38
-
39
-
40
-
41
-
42
-
43
-
44
-
45
-
46
-
47
-
48
-
49
-
50
-
51
-
52
-
53
-
54
-
55
-
56
-
57
-
58
-
59
-
60
-
61
-
62
-
63
-
64
-
65
-
66
-
67
-
68
-
69
-
70
-
71
-
72
-
73
-
74
-
75
-
76
-
77
-
78
-
79
-
80
-
81
-
82
-
83
-
84
-
85
-
86
-
87
-
88
-
89
-
90
-
91
-
92
-
93
-
94
-
95
-
96
-
97
-
98
-
99
-
100
-
101
-
102
-
103
-
104
-
105
-
106
-
107
-
108
-
109
-
110
-
111
-
112
-
113
-
114
-
115
-
116
-
117
-
118
-
119
-
120
-
121
-
122
-
123
-
124
-
125
-
126
-
127
-
128
-
129
-
130
-
131
-
132
-
133
-
134
-
135
-
136
-
137
-
138
-
139
-
140
-
141
-
142
-
 143
143 -
 144
144 -
 145
145 -
 146
146 -
 147
147 -
 148
148 -
 149
149 -
 150
150 -
 151
151 -
 152
152 -
 153
153 -
 154
154 -
 155
155 -
 156
156 -
 157
157 -
 158
158 -
 159
159 -
 160
160 -
 161
161 -
 162
162 -
 163
163 -
164
-
165
-
166
-
167
-
168
-
169
-
170
-
171
-
172
-
173
-
174
-
175
-
176
-
177
-
178
-
179
-
180
-
181
-
182
-
183
-
184
-
185
-
186
-
187
-
188
-
189
-
190
-
191
-
192
-
193
-
194
-
195
-
196
-
197
-
198
-
199
-
200
-
201
-
202
-
203
-
204
-
205
-
206
-
207
-
208
-
209
-
210
-
211
-
212
-
213
-
214
-
215
-
216
-
217
-
218
-
219
-
220
-
221
-
222
-
223
-
224
-
225
-
226
-
227
-
228
-
229
-
230
-
231
-
232
-
233
-
234
-
235
-
236
-
237
-
238
-
239
-
240
-
241
-
242
-
243
-
244
-
245
-
246
-
247
-
248
-
249
-
250
-
251
-
252
-
253
-
254
-
255
-
256
-
257
-
258
-
259
-
260
-
261
-
262
-
263
-
264
-
265
-
266
-
267
-
268
-
269
-
270
-
271
-
272
-
273
-
274
-
275
-
276
-
277
-
278
-
279
-
280
-
281
-
282
-
283
-
284
-
285
-
286
-
287
-
288
-
289
-
290
-
291
-
292
-
293
-
294
-
295
-
296
-
297
-
298
-
299
-
300
-
301
-
302
-
303
-
304
-
305
-
306
-
307
-
308
-
309
-
310
-
311
-
312
-
313
-
314
-
315
-
316
-
317
-
318
-
319
-
320
-
321
-
322
-
323
-
324
-
325
-
326
-
327
-
328
-
329
-
330
-
331
-
332
-
333
-
334
-
335
-
336
-
337
-
338
-
339
-
340
-
341
-
342
-
343
-
344
-
345
-
346
 |
 |

Notes
152 Consolidated
Financial
Statements
at 31 December
2012
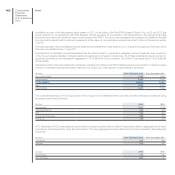
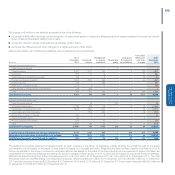
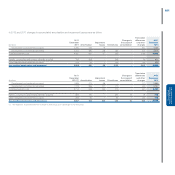
10. Financial income/(expenses)
In addition to the items included in the specific lines of the income statement, the following table also includes for information purposes the interest income
from customers and other financial income of financial services companies otherwise included in Net revenues for €277 million (€235 million in 2011) and
Interest cost and other financial charges from financial services companies otherwise included in Cost of sales for €158 million (€148 million in 2011).
(€ million) 2012 2011 (*)
Financial income:
Interest income and other financial income 254 352
Interest income from customers and other financial income of financial services companies 277 235
Gains on disposal of securities 22
Total Financial income 533 589
of which:
Financial income, excluding financial services companies (a) 256 354
Interest cost and other financial expenses:
Interest expense and other financial expenses 1,936 1,588
Write-downs of financial assets 50 43
Losses on disposal of securities 911
Interest costs on employee benefits 144 96
Total Interest and other financial expenses 2,139 1,738
Net (income)/expenses from derivative financial instruments and exchange rate differences (84) 46
Total interest and other financial expenses, net (income) expenses from derivative financial instruments
and exchange differences 2,055 1,784
of which:
Interest cost and other financial expenses, net (income) expenses from derivative financial instruments and exchange rate
differences, excluding financial services companies (b) 1,897 1,636
Net financial income (expenses) excluding financial services companies (a) – (b) (1,641) (1,282)
(*) Amounts reported for 2011 include the consolidation of Chrysler from 1 June 2011.
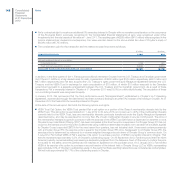
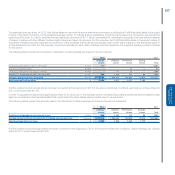
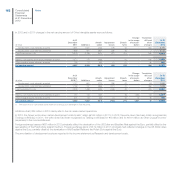
Net financial expenses in 2012 (excluding the financial services companies) amount to €1,641 million. This amount includes the net financial expenses
of Chrysler of €816 million (€486 million in the 7 months to 31 December 2011), of which interest costs on employee benefit provisions of €104 million
(€54 million in the 7 months to 31 December 2011). Net financial expenses also include net income of €34 million (net expense of €108 million in 2011)
arising from the equity swaps on Fiat S.p.A. and Fiat Industrial S.p.A. shares relating to certain stock option plans.
In 2011, Interest income and other financial income included an income of €72 million calculated after the Demerger on the basis of market values and
relating to the early repayment of the outstanding medium-term financial receivables due from the Fiat Industrial group at 31 December 2010.
Interest income and other financial income may be analysed as follows:
(€ million) 2012 2011 (*)
Interest income from banks deposits 168 211
Interest income from securities 14 8
Commission income --
Other interest income and financial income 72 133
Total Interest income and other financial income 254 352
(*) Amounts reported for 2011 include the consolidation of Chrysler from 1 June 2011.