Chrysler 2012 Annual Report Download - page 166
Download and view the complete annual report
Please find page 166 of the 2012 Chrysler annual report below. You can navigate through the pages in the report by either clicking on the pages listed below, or by using the keyword search tool below to find specific information within the annual report.-
 1
1 -
2
-
3
-
4
-
5
-
6
-
7
-
8
-
9
-
10
-
11
-
12
-
13
-
14
-
15
-
16
-
17
-
18
-
19
-
20
-
21
-
22
-
23
-
24
-
25
-
26
-
27
-
28
-
29
-
30
-
31
-
32
-
33
-
34
-
35
-
36
-
37
-
38
-
39
-
40
-
41
-
42
-
43
-
44
-
45
-
46
-
47
-
48
-
49
-
50
-
51
-
52
-
53
-
54
-
55
-
56
-
57
-
58
-
59
-
60
-
61
-
62
-
63
-
64
-
65
-
66
-
67
-
68
-
69
-
70
-
71
-
72
-
73
-
74
-
75
-
76
-
77
-
78
-
79
-
80
-
81
-
82
-
83
-
84
-
85
-
86
-
87
-
88
-
89
-
90
-
91
-
92
-
93
-
94
-
95
-
96
-
97
-
98
-
99
-
100
-
101
-
102
-
103
-
104
-
105
-
106
-
107
-
108
-
109
-
110
-
111
-
112
-
113
-
114
-
115
-
116
-
117
-
118
-
119
-
120
-
121
-
122
-
123
-
124
-
125
-
126
-
127
-
128
-
129
-
130
-
131
-
132
-
133
-
134
-
135
-
136
-
137
-
138
-
139
-
140
-
141
-
142
-
143
-
144
-
145
-
146
-
147
-
148
-
149
-
150
-
151
-
152
-
153
-
154
-
155
-
 156
156 -
 157
157 -
 158
158 -
 159
159 -
 160
160 -
 161
161 -
 162
162 -
 163
163 -
 164
164 -
 165
165 -
 166
166 -
 167
167 -
 168
168 -
 169
169 -
 170
170 -
 171
171 -
 172
172 -
 173
173 -
 174
174 -
 175
175 -
 176
176 -
177
-
178
-
179
-
180
-
181
-
182
-
183
-
184
-
185
-
186
-
187
-
188
-
189
-
190
-
191
-
192
-
193
-
194
-
195
-
196
-
197
-
198
-
199
-
200
-
201
-
202
-
203
-
204
-
205
-
206
-
207
-
208
-
209
-
210
-
211
-
212
-
213
-
214
-
215
-
216
-
217
-
218
-
219
-
220
-
221
-
222
-
223
-
224
-
225
-
226
-
227
-
228
-
229
-
230
-
231
-
232
-
233
-
234
-
235
-
236
-
237
-
238
-
239
-
240
-
241
-
242
-
243
-
244
-
245
-
246
-
247
-
248
-
249
-
250
-
251
-
252
-
253
-
254
-
255
-
256
-
257
-
258
-
259
-
260
-
261
-
262
-
263
-
264
-
265
-
266
-
267
-
268
-
269
-
270
-
271
-
272
-
273
-
274
-
275
-
276
-
277
-
278
-
279
-
280
-
281
-
282
-
283
-
284
-
285
-
286
-
287
-
288
-
289
-
290
-
291
-
292
-
293
-
294
-
295
-
296
-
297
-
298
-
299
-
300
-
301
-
302
-
303
-
304
-
305
-
306
-
307
-
308
-
309
-
310
-
311
-
312
-
313
-
314
-
315
-
316
-
317
-
318
-
319
-
320
-
321
-
322
-
323
-
324
-
325
-
326
-
327
-
328
-
329
-
330
-
331
-
332
-
333
-
334
-
335
-
336
-
337
-
338
-
339
-
340
-
341
-
342
-
343
-
344
-
345
-
346
 |
 |
165
Consolidated
Financial Statements
at 31 December 2012
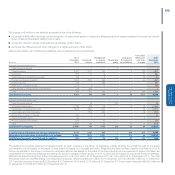
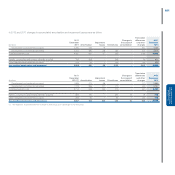
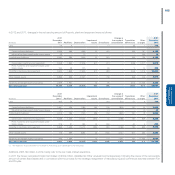
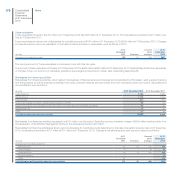
In 2012 and 2011, changes in the net carrying amount of Property, plant and equipment were as follows:
(€ million)
At 31
December
2011 Additions Depreciation
Impairment
losses Divestitures
Change in
the scope of
consolidation
Translation
differences
Other
changes
At 31
December
2012
Land 719 4 - - (7) - (8) 1709
Owned industrial buildings 3,939 386 (253) (2) (20) - (48) 167 4,169
Industrial buildings leased under finance leases 43 - (1) - - - - (28) 14
Total Industrial buildings 3,982 386 (254) (2) (20) - (48) 139 4,183
Owned plant, machinery and equipment 9,268 1,830 (1,915) (47) (27) - (148) 1,017 9,978
Plant, machinery and equipment leased under
finance leases 254 29 (27) - (3) - 2 (1) 254
Total Plant, machinery and equipment 9,522 1,859 (1,942) (47) (30) - (146) 1,016 10,232
Other tangible assets 3,893 939 (1,057) - (19) - (58) (24) 3,674
Advances and tangible assets in progress 2,669 1,961 - (1) (9) - (104) (1,253) 3,263
Net carrying amount 20,785 5,149 (3,253) (50) (85) - (364) (121) 22,061
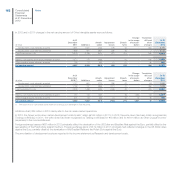
(€ million)
At 31
December
2010 (*) Additions Depreciation
Impairment
losses Divestitures
Change in
the scope of
consolidation
Translation
differences
Other
changes
At 31
December
2011
Land 365 24 - - (10) 310 21 9 719
Owned industrial buildings 1,967 235 (189) (35) (15) 1,825 131 20 3,939
Industrial buildings leased under finance leases 47 - (2) - (1) - - (1) 43
Total Industrial buildings 2,014 235 (191) (35) (16) 1,825 131 19 3,982
Owned plant, machinery and equipment 5,588 1,456 (1,640) (281) (4) 3,188 132 829 9,268
Plant, machinery and equipment leased under
finance leases 275 37 (30) (4) (26) - (2) 4 254
Total Plant, machinery and equipment 5,863 1,493 (1,670) (285) (30) 3,188 130 833 9,522
Other tangible assets 416 589 (684) (2) (105) 3,147 302 230 3,893
Advances and tangible assets in progress 943 1,584 - (1) (72) 1,201 122 (1,108) 2,669
Net carrying amount 9,601 3,925 (2,545) (323) (233) 9,671 706 (17) 20,785
(*) The balances at 31 December 2010 relate to Fiat Group post demerger to Fiat Industrial.
Additions of €5,149 million in 2012 mainly refer to the car mass-market operations.
In 2011 the Group recognised impairment losses of €302 million, classified as Other unusual income/(expenses), following the review of the recoverable
amount of certain fixed assets and in connection with the process for the strategic realignment of manufacturing and commercial activities between Fiat
and Chrysler.