Chrysler 2012 Annual Report Download - page 163
Download and view the complete annual report
Please find page 163 of the 2012 Chrysler annual report below. You can navigate through the pages in the report by either clicking on the pages listed below, or by using the keyword search tool below to find specific information within the annual report.-
 1
1 -
2
-
3
-
4
-
5
-
6
-
7
-
8
-
9
-
10
-
11
-
12
-
13
-
14
-
15
-
16
-
17
-
18
-
19
-
20
-
21
-
22
-
23
-
24
-
25
-
26
-
27
-
28
-
29
-
30
-
31
-
32
-
33
-
34
-
35
-
36
-
37
-
38
-
39
-
40
-
41
-
42
-
43
-
44
-
45
-
46
-
47
-
48
-
49
-
50
-
51
-
52
-
53
-
54
-
55
-
56
-
57
-
58
-
59
-
60
-
61
-
62
-
63
-
64
-
65
-
66
-
67
-
68
-
69
-
70
-
71
-
72
-
73
-
74
-
75
-
76
-
77
-
78
-
79
-
80
-
81
-
82
-
83
-
84
-
85
-
86
-
87
-
88
-
89
-
90
-
91
-
92
-
93
-
94
-
95
-
96
-
97
-
98
-
99
-
100
-
101
-
102
-
103
-
104
-
105
-
106
-
107
-
108
-
109
-
110
-
111
-
112
-
113
-
114
-
115
-
116
-
117
-
118
-
119
-
120
-
121
-
122
-
123
-
124
-
125
-
126
-
127
-
128
-
129
-
130
-
131
-
132
-
133
-
134
-
135
-
136
-
137
-
138
-
139
-
140
-
141
-
142
-
143
-
144
-
145
-
146
-
147
-
148
-
149
-
150
-
151
-
152
-
 153
153 -
 154
154 -
 155
155 -
 156
156 -
 157
157 -
 158
158 -
 159
159 -
 160
160 -
 161
161 -
 162
162 -
 163
163 -
 164
164 -
 165
165 -
 166
166 -
 167
167 -
 168
168 -
 169
169 -
 170
170 -
 171
171 -
 172
172 -
 173
173 -
174
-
175
-
176
-
177
-
178
-
179
-
180
-
181
-
182
-
183
-
184
-
185
-
186
-
187
-
188
-
189
-
190
-
191
-
192
-
193
-
194
-
195
-
196
-
197
-
198
-
199
-
200
-
201
-
202
-
203
-
204
-
205
-
206
-
207
-
208
-
209
-
210
-
211
-
212
-
213
-
214
-
215
-
216
-
217
-
218
-
219
-
220
-
221
-
222
-
223
-
224
-
225
-
226
-
227
-
228
-
229
-
230
-
231
-
232
-
233
-
234
-
235
-
236
-
237
-
238
-
239
-
240
-
241
-
242
-
243
-
244
-
245
-
246
-
247
-
248
-
249
-
250
-
251
-
252
-
253
-
254
-
255
-
256
-
257
-
258
-
259
-
260
-
261
-
262
-
263
-
264
-
265
-
266
-
267
-
268
-
269
-
270
-
271
-
272
-
273
-
274
-
275
-
276
-
277
-
278
-
279
-
280
-
281
-
282
-
283
-
284
-
285
-
286
-
287
-
288
-
289
-
290
-
291
-
292
-
293
-
294
-
295
-
296
-
297
-
298
-
299
-
300
-
301
-
302
-
303
-
304
-
305
-
306
-
307
-
308
-
309
-
310
-
311
-
312
-
313
-
314
-
315
-
316
-
317
-
318
-
319
-
320
-
321
-
322
-
323
-
324
-
325
-
326
-
327
-
328
-
329
-
330
-
331
-
332
-
333
-
334
-
335
-
336
-
337
-
338
-
339
-
340
-
341
-
342
-
343
-
344
-
345
-
346
 |
 |

Notes
162 Consolidated
Financial
Statements
at 31 December
2012
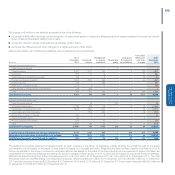
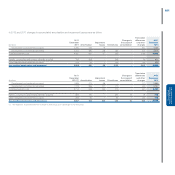
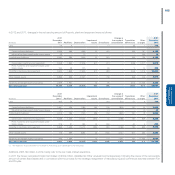
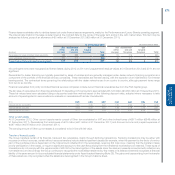
In 2012 and in 2011 changes in the net carrying amount of Other intangible assets were as follows:
(€ million)
At 31
December
2011 Additions
Amorti-
sation
Impairment
losses
Divesti-
tures
Change
in the scope
of consoli-
dation
Translation
diff. and
other
changes
At 31
December
2012
Development costs externally acquired 1,561 1,547 (234) (19) (4) - (60) 2,791
Development costs internally generated 1,959 591 (387) (38) (6) - 2 2,121
Total Development costs 3,520 2,138 (621) (57) (10) - (58) 4,912
Patents, concessions and licenses externally acquired 1,277 175 (208) - (1) - (18) 1,225
Other intangible assets externally acquired 190 72 (52) (1) (1) - (8) 200
Net carrying amount 4,987 2,385 (881) (58) (12) - (84) 6,337
(€ million)
At 31
December
2010 (*) Additions
Amorti-
sation
Impairment
losses
Divesti-
tures
Change
in the scope
of consoli-
dation
Translation
diff. and
other
changes
At 31
December
2011
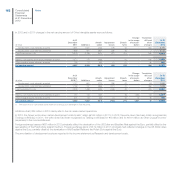
Development costs externally acquired 1,127 681 (270) (38) (2) - 63 1,561
Development costs internally generated 1,782 757 (356) (127) (1) - (96) 1,959
Total Development costs 2,909 1,438 (626) (165) (3) - (33) 3,520
Patents, concessions and licenses externally acquired 157 115 (137) - (6) 1,033 115 1,277
Other intangible assets externally acquired 201 50 (50) (1) (2) (2) (6) 190
Net carrying amount 3,267 1,603 (813) (166) (11) 1,031 76 4,987
(*) The balances at 31 December 2010 relate to Fiat Group post demerger to Fiat Industrial.
Additions of €2,385 million in 2012 mainly refer to the car mass-market operations.
In 2012, the Group wrote-down certain development costs by €57 million (€165 million in 2011). In 2012, the write-down has been totally recognised as
Trading profit/(loss). In 2011, the write-down had been recognised as Trading profit/(loss) for €4 million and for €161 million as Other unusual income/
(expenses) in the income statement.
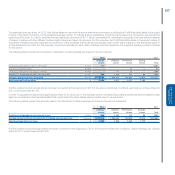
Foreign exchange losses of €87 million in 2012 principally reflect the devaluation of the US Dollar and Brazilian Real against the Euro, partially offset by the
appreciation of the Polish Zloty against the Euro. Foreign exchange gains of € 72 million in 2011 principally had reflected changes in the US Dollar rates
against the Euro, partially offset by the devaluation of the Brazilian Real and the Polish Zloty against the Euro.
The amortisation of development costs are reported in the income statement as Research and development costs.