Chrysler 2012 Annual Report Download - page 127
Download and view the complete annual report
Please find page 127 of the 2012 Chrysler annual report below. You can navigate through the pages in the report by either clicking on the pages listed below, or by using the keyword search tool below to find specific information within the annual report.-
 1
1 -
2
-
3
-
4
-
5
-
6
-
7
-
8
-
9
-
10
-
11
-
12
-
13
-
14
-
15
-
16
-
17
-
18
-
19
-
20
-
21
-
22
-
23
-
24
-
25
-
26
-
27
-
28
-
29
-
30
-
31
-
32
-
33
-
34
-
35
-
36
-
37
-
38
-
39
-
40
-
41
-
42
-
43
-
44
-
45
-
46
-
47
-
48
-
49
-
50
-
51
-
52
-
53
-
54
-
55
-
56
-
57
-
58
-
59
-
60
-
61
-
62
-
63
-
64
-
65
-
66
-
67
-
68
-
69
-
70
-
71
-
72
-
73
-
74
-
75
-
76
-
77
-
78
-
79
-
80
-
81
-
82
-
83
-
84
-
85
-
86
-
87
-
88
-
89
-
90
-
91
-
92
-
93
-
94
-
95
-
96
-
97
-
98
-
99
-
100
-
101
-
102
-
103
-
104
-
105
-
106
-
107
-
108
-
109
-
110
-
111
-
112
-
113
-
114
-
115
-
116
-
 117
117 -
 118
118 -
 119
119 -
 120
120 -
 121
121 -
 122
122 -
 123
123 -
 124
124 -
 125
125 -
 126
126 -
 127
127 -
 128
128 -
 129
129 -
 130
130 -
 131
131 -
 132
132 -
 133
133 -
 134
134 -
 135
135 -
 136
136 -
 137
137 -
138
-
139
-
140
-
141
-
142
-
143
-
144
-
145
-
146
-
147
-
148
-
149
-
150
-
151
-
152
-
153
-
154
-
155
-
156
-
157
-
158
-
159
-
160
-
161
-
162
-
163
-
164
-
165
-
166
-
167
-
168
-
169
-
170
-
171
-
172
-
173
-
174
-
175
-
176
-
177
-
178
-
179
-
180
-
181
-
182
-
183
-
184
-
185
-
186
-
187
-
188
-
189
-
190
-
191
-
192
-
193
-
194
-
195
-
196
-
197
-
198
-
199
-
200
-
201
-
202
-
203
-
204
-
205
-
206
-
207
-
208
-
209
-
210
-
211
-
212
-
213
-
214
-
215
-
216
-
217
-
218
-
219
-
220
-
221
-
222
-
223
-
224
-
225
-
226
-
227
-
228
-
229
-
230
-
231
-
232
-
233
-
234
-
235
-
236
-
237
-
238
-
239
-
240
-
241
-
242
-
243
-
244
-
245
-
246
-
247
-
248
-
249
-
250
-
251
-
252
-
253
-
254
-
255
-
256
-
257
-
258
-
259
-
260
-
261
-
262
-
263
-
264
-
265
-
266
-
267
-
268
-
269
-
270
-
271
-
272
-
273
-
274
-
275
-
276
-
277
-
278
-
279
-
280
-
281
-
282
-
283
-
284
-
285
-
286
-
287
-
288
-
289
-
290
-
291
-
292
-
293
-
294
-
295
-
296
-
297
-
298
-
299
-
300
-
301
-
302
-
303
-
304
-
305
-
306
-
307
-
308
-
309
-
310
-
311
-
312
-
313
-
314
-
315
-
316
-
317
-
318
-
319
-
320
-
321
-
322
-
323
-
324
-
325
-
326
-
327
-
328
-
329
-
330
-
331
-
332
-
333
-
334
-
335
-
336
-
337
-
338
-
339
-
340
-
341
-
342
-
343
-
344
-
345
-
346
 |
 |

126 Consolidated
Financial
Statements
at 31 December
2012
Income Statement
pursuant to
Consob Resolution
15519 of
27 July 2006
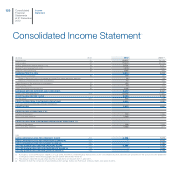
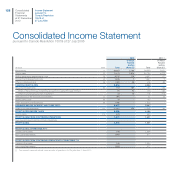
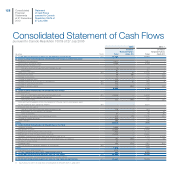
Consolidated Income Statement
pursuant to Consob Resolution 15519 of 27 July 2006
2012 2011 (*)
(€ million) Note Total
of which
Related
parties
(Note 37) Total
of which
Related
parties
(Note 37)
Net revenues (1) 83,957 2,793 59,559 2,970
Cost of sales (2) 71,474 3,674 50,704 4,272
Selling, general and administrative costs (3) 6,731 116 5,047 117
Research and development costs (4) 1,835 7 1,367 2
Other income/(expenses) (5) (103) 20 (49) 35
TRADING PROFIT/(LOSS) 3,814 2,392
Result from investments: (6) 107 107 131 136
Share of the profit/(loss) of investees accounted for using the equity method 94 94 146 146
Other income/(expenses) from investments 13 13 (15) (10)
Gains/(losses) on the disposal of investments (7) (91) - 21 12
Restructuring costs (8) 15 - 102 -
Other unusual income/(expenses) (9) (138) - 1,025 -
EARNINGS BEFORE INTEREST AND TAXES (EBIT) 3,677 3,467
Financial income/(expenses) (10) (1,641) (25) (1,282) 40
PROFIT/(LOSS) BEFORE TAXES 2,036 2,185
Income taxes (11) 625 534
PROFIT/(LOSS) FROM CONTINUING OPERATIONS 1,411 1,651
Post-tax profit/(loss) from Discontinued Operations --
PROFIT/(LOSS) 1,411 1,651
PROFIT/(LOSS) ATTRIBUTABLE TO:
Owners of the parent 348 1,334
Non-controlling interests 1,063 317
PROFIT/(LOSS) FROM CONTINUING OPERATIONS ATTRIBUTABLE TO:
Owners of the parent 348 1,334
Non-controlling interests 1,063 317
(*) The amounts reported include seven months of operations for Chrysler from 1 June 2011.