Chrysler 2012 Annual Report Download - page 160
Download and view the complete annual report
Please find page 160 of the 2012 Chrysler annual report below. You can navigate through the pages in the report by either clicking on the pages listed below, or by using the keyword search tool below to find specific information within the annual report.-
 1
1 -
2
-
3
-
4
-
5
-
6
-
7
-
8
-
9
-
10
-
11
-
12
-
13
-
14
-
15
-
16
-
17
-
18
-
19
-
20
-
21
-
22
-
23
-
24
-
25
-
26
-
27
-
28
-
29
-
30
-
31
-
32
-
33
-
34
-
35
-
36
-
37
-
38
-
39
-
40
-
41
-
42
-
43
-
44
-
45
-
46
-
47
-
48
-
49
-
50
-
51
-
52
-
53
-
54
-
55
-
56
-
57
-
58
-
59
-
60
-
61
-
62
-
63
-
64
-
65
-
66
-
67
-
68
-
69
-
70
-
71
-
72
-
73
-
74
-
75
-
76
-
77
-
78
-
79
-
80
-
81
-
82
-
83
-
84
-
85
-
86
-
87
-
88
-
89
-
90
-
91
-
92
-
93
-
94
-
95
-
96
-
97
-
98
-
99
-
100
-
101
-
102
-
103
-
104
-
105
-
106
-
107
-
108
-
109
-
110
-
111
-
112
-
113
-
114
-
115
-
116
-
117
-
118
-
119
-
120
-
121
-
122
-
123
-
124
-
125
-
126
-
127
-
128
-
129
-
130
-
131
-
132
-
133
-
134
-
135
-
136
-
137
-
138
-
139
-
140
-
141
-
142
-
143
-
144
-
145
-
146
-
147
-
148
-
149
-
 150
150 -
 151
151 -
 152
152 -
 153
153 -
 154
154 -
 155
155 -
 156
156 -
 157
157 -
 158
158 -
 159
159 -
 160
160 -
 161
161 -
 162
162 -
 163
163 -
 164
164 -
 165
165 -
 166
166 -
 167
167 -
 168
168 -
 169
169 -
 170
170 -
171
-
172
-
173
-
174
-
175
-
176
-
177
-
178
-
179
-
180
-
181
-
182
-
183
-
184
-
185
-
186
-
187
-
188
-
189
-
190
-
191
-
192
-
193
-
194
-
195
-
196
-
197
-
198
-
199
-
200
-
201
-
202
-
203
-
204
-
205
-
206
-
207
-
208
-
209
-
210
-
211
-
212
-
213
-
214
-
215
-
216
-
217
-
218
-
219
-
220
-
221
-
222
-
223
-
224
-
225
-
226
-
227
-
228
-
229
-
230
-
231
-
232
-
233
-
234
-
235
-
236
-
237
-
238
-
239
-
240
-
241
-
242
-
243
-
244
-
245
-
246
-
247
-
248
-
249
-
250
-
251
-
252
-
253
-
254
-
255
-
256
-
257
-
258
-
259
-
260
-
261
-
262
-
263
-
264
-
265
-
266
-
267
-
268
-
269
-
270
-
271
-
272
-
273
-
274
-
275
-
276
-
277
-
278
-
279
-
280
-
281
-
282
-
283
-
284
-
285
-
286
-
287
-
288
-
289
-
290
-
291
-
292
-
293
-
294
-
295
-
296
-
297
-
298
-
299
-
300
-
301
-
302
-
303
-
304
-
305
-
306
-
307
-
308
-
309
-
310
-
311
-
312
-
313
-
314
-
315
-
316
-
317
-
318
-
319
-
320
-
321
-
322
-
323
-
324
-
325
-
326
-
327
-
328
-
329
-
330
-
331
-
332
-
333
-
334
-
335
-
336
-
337
-
338
-
339
-
340
-
341
-
342
-
343
-
344
-
345
-
346
 |
 |

159
Consolidated
Financial Statements
at 31 December 2012
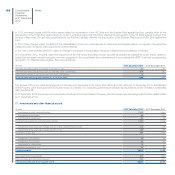
As of 31 December 2011, goodwill related to the acquisition of control of Chrysler was fully allocated to the Chrysler reporting segment. Effective
1 September 2011, the Group undertook significant organizational changes, including the operations of the mass-market brands. The mass-market brands
were previously reported under the sectors of Fiat Group Automobiles, Fiat Powertrain and Chrysler. The mass market brands are now being attributed to
four geographical regions. Refer to Note 33 for additional information regarding the organizational changes and the Group’s reporting segments. Effective
1 January 2012, the reporting segments have been revised to reflect the new structure of the Group and the goodwill related to the former Chrysler reporting
segment has been reallocated to the applicable regions.
From an operating standpoint, substantially all of Chrysler’s industrial and product development asset base is located in NAFTA while the other regions
manage the distribution of Chrysler Group vehicles in their respective markets with the exception of limited assembly activity of certain Chrysler Group
vehicles in LATAM.
On 1 January 2012, goodwill was reallocated to each region based on the relative value of the total invested capital of each region that comprised the former
Chrysler operating segment.
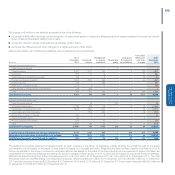
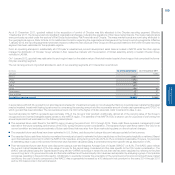
The net carrying amount of goodwill allocated to each of our operating segments at 31 December is as follows:
(€ million) At 31 December 2012 At 31 December 2011
Chrysler -9,585
NAFTA 7,661 -
APAC 1,012 -
LATAM 482 -
EMEA 217 -
Ferrari 786 786
Components 51 51
Other activities 21 21
Goodwill (net carrying amount) 10,230 10,443
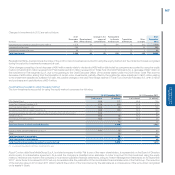
In accordance with IAS 36, goodwill is not amortised and is tested for impairment annually or more frequently if facts or circumstances indicate that the asset
may be impaired. Impairment testing is performed by comparing the carrying amount and the recoverable amount of each cash-generating unit (“CGU”) to
which goodwill has been allocated. The recoverable amount of a CGU is the higher of its fair value less costs to sell and its value in use.
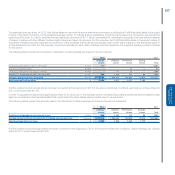
Goodwill allocated to NAFTA represents approximately 75% of the Group’s total goodwill. Additionally, almost all of the carrying value of the Group’s
recognized brand names intangible assets pertain to the NAFTA region. The estimate of the NAFTA CGU’s value in use for purposes of performing the
annual impairment test was based on the following assumptions:
The expected future cash flows for the NAFTA region covering the period from 2013 through 2016. These cash flows represent management’s best
estimate of the future operating performance of the CGU during the period under consideration. The expected future cash flows relate to the CGU in its
current condition and exclude any estimate of future cash flows that may arise from future restructuring plans or other structural changes.
The expected future cash flows have been estimated in U.S. Dollars, and discounted using a discount rate appropriate for that currency.
The expected future cash flows include a normalised terminal period used to estimate the future results beyond the time period explicitly considered. Based
upon the business environment in which the NAFTA CGU operates, a long-term growth rate of 2% to 3% is considered reasonable. However, for purposes
of estimating value in use in this context, the terminal value has been calculated using a conservative long-term growth rate (g) assumption of 0%.
Post-tax expected future cash flows were discounted using a post-tax Weighted Average Cost of Capital (“WACC”) of 8.3%. The WACC used reflects
the current market assessment of the time value of money for the period being considered and the risks specific to the CGU under consideration. The
WACC was calculated using the Capital Asset Pricing Model (“CAPM”) technique in which the risk free rate has been calculated by referring to the yield
curve of long-term U.S. government bonds and the beta coefficient and the debt/equity ratio have been extrapolated by analysing a group of comparable
companies operating in the automotive sector. Additionally, to prudently consider the uncertainty of the current economic environment and future market
conditions, the cost of equity component of the WACC was progressively increased by a 50 basis point risk premium for the years 2014 through 2016
and by 300 basis points in the terminal period.