Chrysler 2012 Annual Report Download - page 189
Download and view the complete annual report
Please find page 189 of the 2012 Chrysler annual report below. You can navigate through the pages in the report by either clicking on the pages listed below, or by using the keyword search tool below to find specific information within the annual report.-
 1
1 -
2
-
3
-
4
-
5
-
6
-
7
-
8
-
9
-
10
-
11
-
12
-
13
-
14
-
15
-
16
-
17
-
18
-
19
-
20
-
21
-
22
-
23
-
24
-
25
-
26
-
27
-
28
-
29
-
30
-
31
-
32
-
33
-
34
-
35
-
36
-
37
-
38
-
39
-
40
-
41
-
42
-
43
-
44
-
45
-
46
-
47
-
48
-
49
-
50
-
51
-
52
-
53
-
54
-
55
-
56
-
57
-
58
-
59
-
60
-
61
-
62
-
63
-
64
-
65
-
66
-
67
-
68
-
69
-
70
-
71
-
72
-
73
-
74
-
75
-
76
-
77
-
78
-
79
-
80
-
81
-
82
-
83
-
84
-
85
-
86
-
87
-
88
-
89
-
90
-
91
-
92
-
93
-
94
-
95
-
96
-
97
-
98
-
99
-
100
-
101
-
102
-
103
-
104
-
105
-
106
-
107
-
108
-
109
-
110
-
111
-
112
-
113
-
114
-
115
-
116
-
117
-
118
-
119
-
120
-
121
-
122
-
123
-
124
-
125
-
126
-
127
-
128
-
129
-
130
-
131
-
132
-
133
-
134
-
135
-
136
-
137
-
138
-
139
-
140
-
141
-
142
-
143
-
144
-
145
-
146
-
147
-
148
-
149
-
150
-
151
-
152
-
153
-
154
-
155
-
156
-
157
-
158
-
159
-
160
-
161
-
162
-
163
-
164
-
165
-
166
-
167
-
168
-
169
-
170
-
171
-
172
-
173
-
174
-
175
-
176
-
177
-
178
-
 179
179 -
 180
180 -
 181
181 -
 182
182 -
 183
183 -
 184
184 -
 185
185 -
 186
186 -
 187
187 -
 188
188 -
 189
189 -
 190
190 -
 191
191 -
 192
192 -
 193
193 -
 194
194 -
 195
195 -
 196
196 -
 197
197 -
 198
198 -
 199
199 -
200
-
201
-
202
-
203
-
204
-
205
-
206
-
207
-
208
-
209
-
210
-
211
-
212
-
213
-
214
-
215
-
216
-
217
-
218
-
219
-
220
-
221
-
222
-
223
-
224
-
225
-
226
-
227
-
228
-
229
-
230
-
231
-
232
-
233
-
234
-
235
-
236
-
237
-
238
-
239
-
240
-
241
-
242
-
243
-
244
-
245
-
246
-
247
-
248
-
249
-
250
-
251
-
252
-
253
-
254
-
255
-
256
-
257
-
258
-
259
-
260
-
261
-
262
-
263
-
264
-
265
-
266
-
267
-
268
-
269
-
270
-
271
-
272
-
273
-
274
-
275
-
276
-
277
-
278
-
279
-
280
-
281
-
282
-
283
-
284
-
285
-
286
-
287
-
288
-
289
-
290
-
291
-
292
-
293
-
294
-
295
-
296
-
297
-
298
-
299
-
300
-
301
-
302
-
303
-
304
-
305
-
306
-
307
-
308
-
309
-
310
-
311
-
312
-
313
-
314
-
315
-
316
-
317
-
318
-
319
-
320
-
321
-
322
-
323
-
324
-
325
-
326
-
327
-
328
-
329
-
330
-
331
-
332
-
333
-
334
-
335
-
336
-
337
-
338
-
339
-
340
-
341
-
342
-
343
-
344
-
345
-
346
 |
 |
Notes
188 Consolidated
Financial
Statements
at 31 December
2012
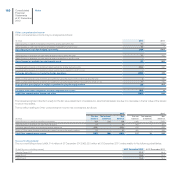
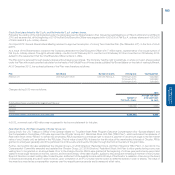
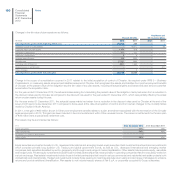
The assumed health care cost trend rate has a significant effect on the amounts reported for postretirement health care and life insurance benefits. A one
percentage point change in the assumed health care cost trend rate for U.S. and Canada combined would have the following effects as of 31 December
2012:
(€ million)
One percentage point
increase
One percentage point
decrease
Effect on the aggregate of the service costs and interest cost 4 (3)
Effect on defined benefit obligation 63 (53)
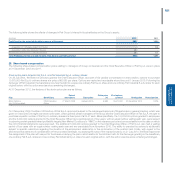
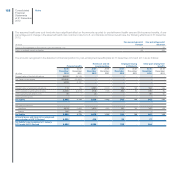
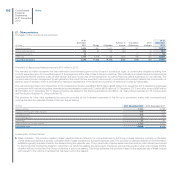
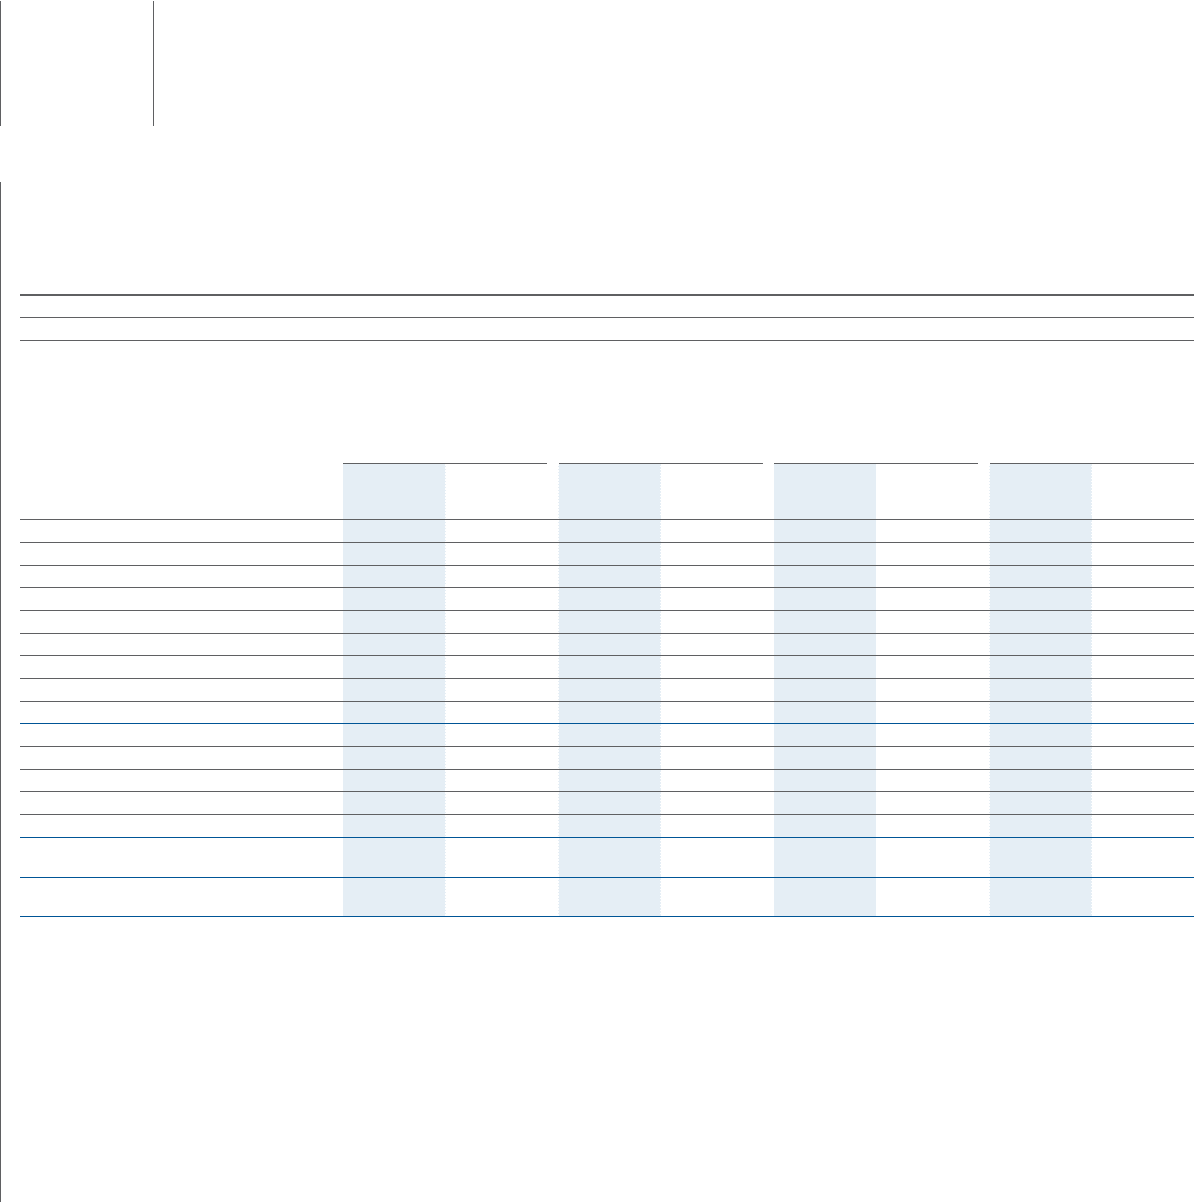
The amounts recognised in the statement of financial position for post-employment benefits plans at 31 December 2012 and 2011 are as follows:
Pension benefits
Healthcare and life
insurance plans
Employee leaving
entitlements
Other post-employment
benefits
(€ million)
At 31
December
2012
At 31
December
2011
At 31
December
2012
At 31
December
2011
At 31
December
2012
At 31
December
2011
At 31
December
2012
At 31
December
2011
Present value of funded obligations 26,853 25,106 ------
Fair Value of plan assets (20,048) (20,004) ------
6,805 5,102 ------
Present value of unfunded obligations 119 95 2,289 2,070 795 763 164 156
Unrecognised actuarial gains/(losses) (4,333) (2,419) (413) (148) (34) 30 (15) (8)
Unrecognised past service cost (6) -(1) ---(2) (3)
Unrecognised assets --------
Net liability 2,585 2,778 1,875 1,922 761 793 147 145
Amounts at year end:
Liabilities 2,679 2,863 1,875 1,922 761 793 147 145
Assets (94) (85) ------
Net liability 2,585 2,778 1,875 1,922 761 793 147 145
Actuarial losses and minor to be recognised
upon adoption of IAS 19 Revised 4,339 -414 -34 -17 -
Net liability to be recognised at 1 January
2013 under IAS 19 Revised 6,924 -2,289 -795 -164 -