Chrysler 2012 Annual Report Download - page 80
Download and view the complete annual report
Please find page 80 of the 2012 Chrysler annual report below. You can navigate through the pages in the report by either clicking on the pages listed below, or by using the keyword search tool below to find specific information within the annual report.-
 1
1 -
2
-
3
-
4
-
5
-
6
-
7
-
8
-
9
-
10
-
11
-
12
-
13
-
14
-
15
-
16
-
17
-
18
-
19
-
20
-
21
-
22
-
23
-
24
-
25
-
26
-
27
-
28
-
29
-
30
-
31
-
32
-
33
-
34
-
35
-
36
-
37
-
38
-
39
-
40
-
41
-
42
-
43
-
44
-
45
-
46
-
47
-
48
-
49
-
50
-
51
-
52
-
53
-
54
-
55
-
56
-
57
-
58
-
59
-
60
-
61
-
62
-
63
-
64
-
65
-
66
-
67
-
68
-
69
-
 70
70 -
 71
71 -
 72
72 -
 73
73 -
 74
74 -
 75
75 -
 76
76 -
 77
77 -
 78
78 -
 79
79 -
 80
80 -
 81
81 -
 82
82 -
 83
83 -
 84
84 -
 85
85 -
 86
86 -
 87
87 -
 88
88 -
 89
89 -
 90
90 -
91
-
92
-
93
-
94
-
95
-
96
-
97
-
98
-
99
-
100
-
101
-
102
-
103
-
104
-
105
-
106
-
107
-
108
-
109
-
110
-
111
-
112
-
113
-
114
-
115
-
116
-
117
-
118
-
119
-
120
-
121
-
122
-
123
-
124
-
125
-
126
-
127
-
128
-
129
-
130
-
131
-
132
-
133
-
134
-
135
-
136
-
137
-
138
-
139
-
140
-
141
-
142
-
143
-
144
-
145
-
146
-
147
-
148
-
149
-
150
-
151
-
152
-
153
-
154
-
155
-
156
-
157
-
158
-
159
-
160
-
161
-
162
-
163
-
164
-
165
-
166
-
167
-
168
-
169
-
170
-
171
-
172
-
173
-
174
-
175
-
176
-
177
-
178
-
179
-
180
-
181
-
182
-
183
-
184
-
185
-
186
-
187
-
188
-
189
-
190
-
191
-
192
-
193
-
194
-
195
-
196
-
197
-
198
-
199
-
200
-
201
-
202
-
203
-
204
-
205
-
206
-
207
-
208
-
209
-
210
-
211
-
212
-
213
-
214
-
215
-
216
-
217
-
218
-
219
-
220
-
221
-
222
-
223
-
224
-
225
-
226
-
227
-
228
-
229
-
230
-
231
-
232
-
233
-
234
-
235
-
236
-
237
-
238
-
239
-
240
-
241
-
242
-
243
-
244
-
245
-
246
-
247
-
248
-
249
-
250
-
251
-
252
-
253
-
254
-
255
-
256
-
257
-
258
-
259
-
260
-
261
-
262
-
263
-
264
-
265
-
266
-
267
-
268
-
269
-
270
-
271
-
272
-
273
-
274
-
275
-
276
-
277
-
278
-
279
-
280
-
281
-
282
-
283
-
284
-
285
-
286
-
287
-
288
-
289
-
290
-
291
-
292
-
293
-
294
-
295
-
296
-
297
-
298
-
299
-
300
-
301
-
302
-
303
-
304
-
305
-
306
-
307
-
308
-
309
-
310
-
311
-
312
-
313
-
314
-
315
-
316
-
317
-
318
-
319
-
320
-
321
-
322
-
323
-
324
-
325
-
326
-
327
-
328
-
329
-
330
-
331
-
332
-
333
-
334
-
335
-
336
-
337
-
338
-
339
-
340
-
341
-
342
-
343
-
344
-
345
-
346
 |
 |

79
Report on Operations
Teksid (Metallurgical Products)
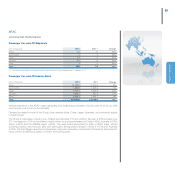
Although the Light Vehicle market registered a 5.7% increase globally in 2012, there was a significant drop in
production in markets where Teksid’s principal customers operate. Western Europe, in particular, was down
8.9% over the prior year with significant contractions in Italy (-16%), France (-14%) and Spain (-18%). Mercosur
was slightly up over the prior year (+0.7%).
For the Heavy Vehicle market, globally there was a contraction of 8%. The core markets for Teksid’s customers
performed worse than average, declining 10% in Western Europe (Italy -17%, Germany -8%) and 26% in
Mercosur (Brazil -29%). By contrast, NAFTA registered a robust increase (+19%) which was insufficient,
however, to offset volume decreases for Teksid in other markets.
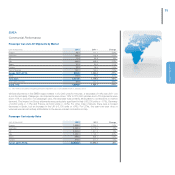
The Cast Iron business unit recorded a 16% decrease in volumes, attributable primarily to lower demand in the
heavy vehicle segment. Revenues were also down 16% for the year (to €680 million in 2012 from €811 million
in 2011).
The Aluminum business unit closed the year with volumes down 5% and revenues down 8% (to €104 million in
2012 from €114 million in 2011).
Comau (Production Systems)
During 2012, Comau’s core market posted positive performance, however, results varied by region.
In North America and Asia, demand remained high with minimal impact from the current uncertainty in financial
markets.
Growth was particularly robust in the U.S. where the big three domestic automakers – Chrysler, General Motors
and Ford – continued upgrade and modernization of their plants and development of new models and engines.
In Asia, activity levels in China and India remained substantially in line with 2011.
In Latin America, new order activity was weak, with a modest slowing during the year.
Activity in Europe was also generally weak, but with conditions varying from market to market. In the UK and
Germany, investment levels were up over the prior year.
New contract orders were down 5% for the year to €1,234 million. The decrease was entirely attributable to the
year-over-year comparison for Powertrain activities, which achieved very high new order levels in 2011.
Overall, 34% of new orders were generated in Europe and 37% in North America, with the remaining 29%
coming from Latin America and Asia. By customer, 27% of orders came from Fiat Group companies and 73%
from other manufacturers. At 31 December 2012, the order backlog totaled €876 million, a 5% increase over
the previous year.
The Services operation maintained its position in Brazil and Argentina, with activity levels substantially unchanged
over 2011.