Chrysler 2012 Annual Report Download - page 55
Download and view the complete annual report
Please find page 55 of the 2012 Chrysler annual report below. You can navigate through the pages in the report by either clicking on the pages listed below, or by using the keyword search tool below to find specific information within the annual report.-
 1
1 -
2
-
3
-
4
-
5
-
6
-
7
-
8
-
9
-
10
-
11
-
12
-
13
-
14
-
15
-
16
-
17
-
18
-
19
-
20
-
21
-
22
-
23
-
24
-
25
-
26
-
27
-
28
-
29
-
30
-
31
-
32
-
33
-
34
-
35
-
36
-
37
-
38
-
39
-
40
-
41
-
42
-
43
-
44
-
 45
45 -
 46
46 -
 47
47 -
 48
48 -
 49
49 -
 50
50 -
 51
51 -
 52
52 -
 53
53 -
 54
54 -
 55
55 -
 56
56 -
 57
57 -
 58
58 -
 59
59 -
 60
60 -
 61
61 -
 62
62 -
 63
63 -
 64
64 -
 65
65 -
66
-
67
-
68
-
69
-
70
-
71
-
72
-
73
-
74
-
75
-
76
-
77
-
78
-
79
-
80
-
81
-
82
-
83
-
84
-
85
-
86
-
87
-
88
-
89
-
90
-
91
-
92
-
93
-
94
-
95
-
96
-
97
-
98
-
99
-
100
-
101
-
102
-
103
-
104
-
105
-
106
-
107
-
108
-
109
-
110
-
111
-
112
-
113
-
114
-
115
-
116
-
117
-
118
-
119
-
120
-
121
-
122
-
123
-
124
-
125
-
126
-
127
-
128
-
129
-
130
-
131
-
132
-
133
-
134
-
135
-
136
-
137
-
138
-
139
-
140
-
141
-
142
-
143
-
144
-
145
-
146
-
147
-
148
-
149
-
150
-
151
-
152
-
153
-
154
-
155
-
156
-
157
-
158
-
159
-
160
-
161
-
162
-
163
-
164
-
165
-
166
-
167
-
168
-
169
-
170
-
171
-
172
-
173
-
174
-
175
-
176
-
177
-
178
-
179
-
180
-
181
-
182
-
183
-
184
-
185
-
186
-
187
-
188
-
189
-
190
-
191
-
192
-
193
-
194
-
195
-
196
-
197
-
198
-
199
-
200
-
201
-
202
-
203
-
204
-
205
-
206
-
207
-
208
-
209
-
210
-
211
-
212
-
213
-
214
-
215
-
216
-
217
-
218
-
219
-
220
-
221
-
222
-
223
-
224
-
225
-
226
-
227
-
228
-
229
-
230
-
231
-
232
-
233
-
234
-
235
-
236
-
237
-
238
-
239
-
240
-
241
-
242
-
243
-
244
-
245
-
246
-
247
-
248
-
249
-
250
-
251
-
252
-
253
-
254
-
255
-
256
-
257
-
258
-
259
-
260
-
261
-
262
-
263
-
264
-
265
-
266
-
267
-
268
-
269
-
270
-
271
-
272
-
273
-
274
-
275
-
276
-
277
-
278
-
279
-
280
-
281
-
282
-
283
-
284
-
285
-
286
-
287
-
288
-
289
-
290
-
291
-
292
-
293
-
294
-
295
-
296
-
297
-
298
-
299
-
300
-
301
-
302
-
303
-
304
-
305
-
306
-
307
-
308
-
309
-
310
-
311
-
312
-
313
-
314
-
315
-
316
-
317
-
318
-
319
-
320
-
321
-
322
-
323
-
324
-
325
-
326
-
327
-
328
-
329
-
330
-
331
-
332
-
333
-
334
-
335
-
336
-
337
-
338
-
339
-
340
-
341
-
342
-
343
-
344
-
345
-
346
 |
 |

54
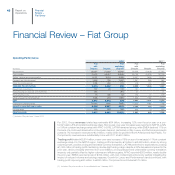
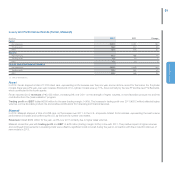
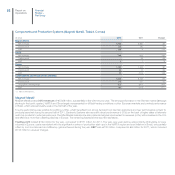
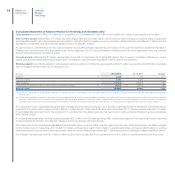
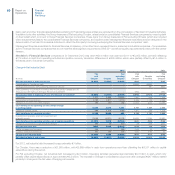
Consolidated Statement of Financial Position for Fiat Group at 31 December 2012
Total assets amounted to €82,119 million at 31 December 2012, increasing €2,088 million over the €80,031 million at the beginning of the year.
Non-current assets totaled €45,477 million, €2 billion higher than the prior year mainly due to the €3.2 billion increase in property, plant & equipment
and intangible assets, net of depreciation and amortization, partially offset by negative currency translation differences (approximately €0.7 billion) and the
decrease in investments and other financial assets of approximately €0.4 billion.
At year-end 2011, investments and other financial assets included €320 million representing the value of Fiat’s right to receive an additional 5% stake in
Chrysler upon achievement of the Ecological Event. At the beginning of 2012, the performance conditions set forth in the agreement were met and that
amount was subsequently reversed to equity.
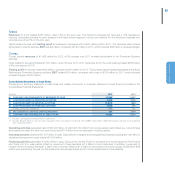
Current assets totaled €36,587 million, substantially in line with 31 December 2011 (€36,488 million). Net of currency translation differences, current
assets were approximately €900 million higher due to increases in cash and cash equivalents (+€550 million) and inventory.
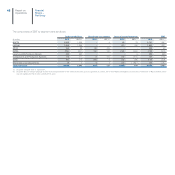
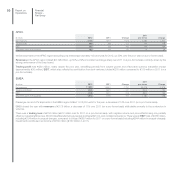
Working capital (net of items relating to vehicles sold under buy-back commitments) was a negative €9,931 million, representing a €238 million decrease
over the negative €9,693 million at 31 December 2011.
(€ million) 31.12.2012 31.12.2011 Change
Inventory (a) 8,340 7,729 611
Trade receivables 2,702 2,625 77
Trade payables (16,558) (16,418) -140
Current taxes receivable/(payable) & Other current receivables/(payables) (b) (4,415) (3,629) -786
Working capital (9,931) (9,693) -238
(a) Inventory is reported net of the value of vehicles sold under buy-back commitments, which includes vehicles still in use by customers and those that have been repurchased and are
held for sale.
(b) Other current payables, included under current taxes receivable/(payable) & other current receivables/(payables), are stated net of amounts due to customers in relation to vehicles sold under
buy-back commitments, which consist of the repurchase amount payable at the end of the lease period, together with the value of any lease installments received in advance. The value at
the beginning of the contract period, equivalent to the difference between the sale price and the repurchase amount, is recognized on a straight-line basis over the contract period.
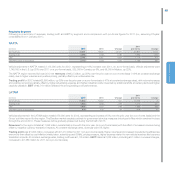
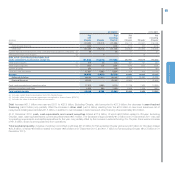
At 31 December 2012, receivables falling due after that date and sold without recourse – and, therefore, eliminated from the statement of financial position
pursuant to the derecognition requirements of IAS 39 – totaled €3,631 million (€3,858 million at 31 December 2011). That amount includes €2,179 million
in receivables (€2,495 million at 31 December 2011), primarily from the dealer network, that were sold to jointly-controlled financial services companies
(FGA Capital Group).
At constant exchange rates, working capital decreased €0.7 billion, with Chrysler reporting a €1.3 billion decrease and Fiat excluding Chrysler reporting
an approximately €0.6 billion increase that reflected reduced business volumes in Europe.
At 31 December 2012, consolidated net debt totaled €9,600 million, up €702 million over the beginning of the year. Excluding Chrysler, net debt increased
by €2.3 billion over 31 December 2011 to €8,103 million, primarily as a result of €3.2 billion in capital expenditure and around €0.6 billion in working
capital absorption, both of which were only partially offset by income-related cash inflows (€1.1 billion) and currency translation differences (€0.2 billion).
For Chrysler, net debt was down €1.6 billion, reflecting €5.9 billion in cash flow from operations net of €4.3 billion in capital expenditure for the period.
Financial
Review –
Fiat Group
Report on
Operations