Chrysler 2012 Annual Report Download - page 201
Download and view the complete annual report
Please find page 201 of the 2012 Chrysler annual report below. You can navigate through the pages in the report by either clicking on the pages listed below, or by using the keyword search tool below to find specific information within the annual report.-
 1
1 -
2
-
3
-
4
-
5
-
6
-
7
-
8
-
9
-
10
-
11
-
12
-
13
-
14
-
15
-
16
-
17
-
18
-
19
-
20
-
21
-
22
-
23
-
24
-
25
-
26
-
27
-
28
-
29
-
30
-
31
-
32
-
33
-
34
-
35
-
36
-
37
-
38
-
39
-
40
-
41
-
42
-
43
-
44
-
45
-
46
-
47
-
48
-
49
-
50
-
51
-
52
-
53
-
54
-
55
-
56
-
57
-
58
-
59
-
60
-
61
-
62
-
63
-
64
-
65
-
66
-
67
-
68
-
69
-
70
-
71
-
72
-
73
-
74
-
75
-
76
-
77
-
78
-
79
-
80
-
81
-
82
-
83
-
84
-
85
-
86
-
87
-
88
-
89
-
90
-
91
-
92
-
93
-
94
-
95
-
96
-
97
-
98
-
99
-
100
-
101
-
102
-
103
-
104
-
105
-
106
-
107
-
108
-
109
-
110
-
111
-
112
-
113
-
114
-
115
-
116
-
117
-
118
-
119
-
120
-
121
-
122
-
123
-
124
-
125
-
126
-
127
-
128
-
129
-
130
-
131
-
132
-
133
-
134
-
135
-
136
-
137
-
138
-
139
-
140
-
141
-
142
-
143
-
144
-
145
-
146
-
147
-
148
-
149
-
150
-
151
-
152
-
153
-
154
-
155
-
156
-
157
-
158
-
159
-
160
-
161
-
162
-
163
-
164
-
165
-
166
-
167
-
168
-
169
-
170
-
171
-
172
-
173
-
174
-
175
-
176
-
177
-
178
-
179
-
180
-
181
-
182
-
183
-
184
-
185
-
186
-
187
-
188
-
189
-
190
-
 191
191 -
 192
192 -
 193
193 -
 194
194 -
 195
195 -
 196
196 -
 197
197 -
 198
198 -
 199
199 -
 200
200 -
 201
201 -
 202
202 -
 203
203 -
 204
204 -
 205
205 -
 206
206 -
 207
207 -
 208
208 -
 209
209 -
 210
210 -
 211
211 -
212
-
213
-
214
-
215
-
216
-
217
-
218
-
219
-
220
-
221
-
222
-
223
-
224
-
225
-
226
-
227
-
228
-
229
-
230
-
231
-
232
-
233
-
234
-
235
-
236
-
237
-
238
-
239
-
240
-
241
-
242
-
243
-
244
-
245
-
246
-
247
-
248
-
249
-
250
-
251
-
252
-
253
-
254
-
255
-
256
-
257
-
258
-
259
-
260
-
261
-
262
-
263
-
264
-
265
-
266
-
267
-
268
-
269
-
270
-
271
-
272
-
273
-
274
-
275
-
276
-
277
-
278
-
279
-
280
-
281
-
282
-
283
-
284
-
285
-
286
-
287
-
288
-
289
-
290
-
291
-
292
-
293
-
294
-
295
-
296
-
297
-
298
-
299
-
300
-
301
-
302
-
303
-
304
-
305
-
306
-
307
-
308
-
309
-
310
-
311
-
312
-
313
-
314
-
315
-
316
-
317
-
318
-
319
-
320
-
321
-
322
-
323
-
324
-
325
-
326
-
327
-
328
-
329
-
330
-
331
-
332
-
333
-
334
-
335
-
336
-
337
-
338
-
339
-
340
-
341
-
342
-
343
-
344
-
345
-
346
 |
 |

Notes
200 Consolidated
Financial
Statements
at 31 December
2012
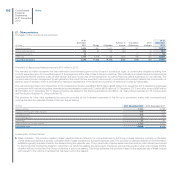
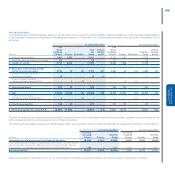
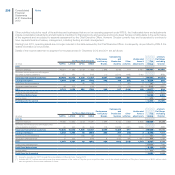
29. Trade payables
Trade payables of €16,558 million at 31 December 2012 increased by €140 million over 31 December 2011. An analysis by due date of trade payables is
as follows:
At 31 December 2012 At 31 December 2011
(€ million)
due within
one year
due between
one and
five years
due beyond
five years Total
due within
one year
due between
one and
five years
due beyond
five years Total
Trade payables 16,557 1 - 16,558 16,402 13 3 16,418
The carrying amount of Trade payables is considered in line with their fair value.
30. Other current liabilities
An analysis of Other current liabilities is as follows:
(€ million) At 31 December 2012 At 31 December 2011
Advances on buy-back agreements 1,198 1,681
Indirect tax payables 1,233 1,289
Accrued expenses and deferred income 1,920 1,737
Payables to personnel 728 672
Social security payables 321 313
Amounts due to customers for contract work (Note 18) 178 110
Other 2,203 1,736
Total Other current liabilities 7,781 7,538
An analysis of Other current liabilities (excluding Accrued expenses and deferred income) by due date is as follows:
At 31 December 2012 At 31 December 2011
(€ million)
due within
one year
due between
one and
five years
due beyond
five years Total
due within
one year
due between
one and
five years
due beyond
five years Total
Total Other current liabilities (excluding Accrued
expenses and deferred income) 5,124 703 34 5,861 5,012 763 26 5,801
The item Advances on buy-back agreements amounting to €1,198 million refers to agreements entered into by the Group during the year or which still
remain effective at the balance sheet date. The item Advances on buy-back agreements represents the following:
at the date of the sale, the price received for the product is recognised as an advance in liabilities;
subsequently, since the difference between the original sales price and the repurchase price is recognised in the income statement as operating lease
instalments on a straight-line basis over the lease term, the balance represents the remaining lease instalments yet to be recognised in income plus the
repurchase price.
Indirect tax payables includes among other taxes on commercial transactions accrued by the Brazilian subsidiary FIASA for which the company (as well
as a number of important industrial groups which operate in Brazil) is awaiting the decision by the Supreme Court against its claim alleging the regime of
double taxation. In March 2007, FIASA received a preliminary trial court decision allowing the payment of such tax on a taxable base consistent with the
company’s position. Since it is a preliminary decision and the amount may be required to be paid to the tax authorities at any time, the difference between
the tax payments as preliminary allowed and the full amount determined as required by the legislation still in force is recognised as liability. Timing for the
Supreme Court decision is not predictable.