Chrysler 2012 Annual Report Download - page 114
Download and view the complete annual report
Please find page 114 of the 2012 Chrysler annual report below. You can navigate through the pages in the report by either clicking on the pages listed below, or by using the keyword search tool below to find specific information within the annual report.-
 1
1 -
2
-
3
-
4
-
5
-
6
-
7
-
8
-
9
-
10
-
11
-
12
-
13
-
14
-
15
-
16
-
17
-
18
-
19
-
20
-
21
-
22
-
23
-
24
-
25
-
26
-
27
-
28
-
29
-
30
-
31
-
32
-
33
-
34
-
35
-
36
-
37
-
38
-
39
-
40
-
41
-
42
-
43
-
44
-
45
-
46
-
47
-
48
-
49
-
50
-
51
-
52
-
53
-
54
-
55
-
56
-
57
-
58
-
59
-
60
-
61
-
62
-
63
-
64
-
65
-
66
-
67
-
68
-
69
-
70
-
71
-
72
-
73
-
74
-
75
-
76
-
77
-
78
-
79
-
80
-
81
-
82
-
83
-
84
-
85
-
86
-
87
-
88
-
89
-
90
-
91
-
92
-
93
-
94
-
95
-
96
-
97
-
98
-
99
-
100
-
101
-
102
-
103
-
 104
104 -
 105
105 -
 106
106 -
 107
107 -
 108
108 -
 109
109 -
 110
110 -
 111
111 -
 112
112 -
 113
113 -
 114
114 -
 115
115 -
 116
116 -
 117
117 -
 118
118 -
 119
119 -
 120
120 -
 121
121 -
 122
122 -
 123
123 -
 124
124 -
125
-
126
-
127
-
128
-
129
-
130
-
131
-
132
-
133
-
134
-
135
-
136
-
137
-
138
-
139
-
140
-
141
-
142
-
143
-
144
-
145
-
146
-
147
-
148
-
149
-
150
-
151
-
152
-
153
-
154
-
155
-
156
-
157
-
158
-
159
-
160
-
161
-
162
-
163
-
164
-
165
-
166
-
167
-
168
-
169
-
170
-
171
-
172
-
173
-
174
-
175
-
176
-
177
-
178
-
179
-
180
-
181
-
182
-
183
-
184
-
185
-
186
-
187
-
188
-
189
-
190
-
191
-
192
-
193
-
194
-
195
-
196
-
197
-
198
-
199
-
200
-
201
-
202
-
203
-
204
-
205
-
206
-
207
-
208
-
209
-
210
-
211
-
212
-
213
-
214
-
215
-
216
-
217
-
218
-
219
-
220
-
221
-
222
-
223
-
224
-
225
-
226
-
227
-
228
-
229
-
230
-
231
-
232
-
233
-
234
-
235
-
236
-
237
-
238
-
239
-
240
-
241
-
242
-
243
-
244
-
245
-
246
-
247
-
248
-
249
-
250
-
251
-
252
-
253
-
254
-
255
-
256
-
257
-
258
-
259
-
260
-
261
-
262
-
263
-
264
-
265
-
266
-
267
-
268
-
269
-
270
-
271
-
272
-
273
-
274
-
275
-
276
-
277
-
278
-
279
-
280
-
281
-
282
-
283
-
284
-
285
-
286
-
287
-
288
-
289
-
290
-
291
-
292
-
293
-
294
-
295
-
296
-
297
-
298
-
299
-
300
-
301
-
302
-
303
-
304
-
305
-
306
-
307
-
308
-
309
-
310
-
311
-
312
-
313
-
314
-
315
-
316
-
317
-
318
-
319
-
320
-
321
-
322
-
323
-
324
-
325
-
326
-
327
-
328
-
329
-
330
-
331
-
332
-
333
-
334
-
335
-
336
-
337
-
338
-
339
-
340
-
341
-
342
-
343
-
344
-
345
-
346
 |
 |

113
Report on Operations
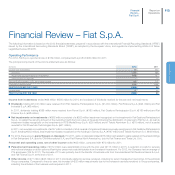
Financial Review – Fiat S.p.A.
The following information is based on the 2012 financial statements prepared in accordance with the International Financial Reporting Standards (“IFRS”)
issued by the International Accounting Standards Board (“IASB”), as adopted by the European Union, and regulations implementing Article 9 of Italian
Legislative Decree 38/2005.
Operating Performance
For 2012, Fiat S.p.A. reported a loss of €152 million, compared with a profit of €99 million for 2011.
The principal components of the income statement were as follows:
(€ million) 2012 2011
Income from investments 68 560
Dividends 1,030 388
Impairment (losses)/reversals on investments (962) 157
Gains/(losses) on disposals -15
Personnel and operating costs, net of other income (35) (70)
Financial income/(expense) (216) (435)
PROFIT/(LOSS) BEFORE TAXES (183) 55
Income taxes 31 44
PROFIT/(LOSS) FOR THE YEAR (152) 99
Income from investments totaled €68 million (€560 million for 2011) and consisted of dividends received for the year and net impairments:
Dividends totaling €1,030 million were received from Fiat Gestione Partecipazioni S.p.A. (€1,000 million), Fiat Finance S.p.A. (€24 million) and Fiat
Industrial S.p.A. (€6 million).
In 2011, dividends totaling €388 million were received from Ferrari S.p.A. (€180 million), Fiat Gestione Partecipazioni S.p.A. (€180 million) and Fiat
Finance S.p.A. (€28 million).
Net impairments on investments of €962 million consisted of a €933 million impairment recognized on the investment in Fiat Gestione Partecipazioni
S.p.A., to realign the carrying amount of the investment with the book value of its equity following the distribution of reserves to Fiat S.p.A., as well as
impairment losses recognized on the investments in RCS MediaGroup S.p.A. (€35 million) and in Teksid Aluminium S.r.l. (€15 million), net of a partial
reversal for Fiat Powertrain Technologies S.p.A. (€21 million).
In 2011, net reversals on investments of €157 million consisted of a full reversal of impairment losses previously recognized on Fiat Gestione Partecipazioni
S.p.A. (totaling €352 million), less impairment losses recognized on the holdings in Comau S.p.A. (€147 million) and Teksid Aluminum S.r.l. (€48 million).
For 2012, there were no gains/(losses) on disposals. For 2011, gains on disposals totaled €15 million and related to gains realized on the shareholdings
in Fiat Switzerland S.A. (sold to CNH International S.A.) and Fiat Finance North America Inc. (sold to Fiat Finance and Trade Ltd. S.A.).
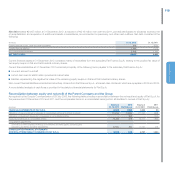
Personnel and operating costs, net of other income totaled €35 million, compared with €70 million for 2011.
Personnel and operating costs of €112 million were substantially in line with the prior year (€115 million in 2011). A reduction in costs for services
and notional charges on stock options offset higher personnel costs attributable to an increase in headcount. For 2012, the Company had an average of
219 employees (104 for 2011). The increase of 115 was primarily due to the transfer of business units from the subsidiaries Fiat Revisione Interna S.c.p.A.
and Fiat Finance S.p.A. at the end of 2011.
Other income of €77 million (€45 million in 2011) principally related to services rendered, including by senior management personnel, to the principal
Group companies. Compared to the prior year, the increase of €32 million was primarily due to the increase in services rendered to Group companies,
including the activities of the business units acquired in 2011.
Financial
Review –
Fiat S.p.A.
Report on
Operations