Chrysler 2012 Annual Report Download - page 213
Download and view the complete annual report
Please find page 213 of the 2012 Chrysler annual report below. You can navigate through the pages in the report by either clicking on the pages listed below, or by using the keyword search tool below to find specific information within the annual report.-
 1
1 -
2
-
3
-
4
-
5
-
6
-
7
-
8
-
9
-
10
-
11
-
12
-
13
-
14
-
15
-
16
-
17
-
18
-
19
-
20
-
21
-
22
-
23
-
24
-
25
-
26
-
27
-
28
-
29
-
30
-
31
-
32
-
33
-
34
-
35
-
36
-
37
-
38
-
39
-
40
-
41
-
42
-
43
-
44
-
45
-
46
-
47
-
48
-
49
-
50
-
51
-
52
-
53
-
54
-
55
-
56
-
57
-
58
-
59
-
60
-
61
-
62
-
63
-
64
-
65
-
66
-
67
-
68
-
69
-
70
-
71
-
72
-
73
-
74
-
75
-
76
-
77
-
78
-
79
-
80
-
81
-
82
-
83
-
84
-
85
-
86
-
87
-
88
-
89
-
90
-
91
-
92
-
93
-
94
-
95
-
96
-
97
-
98
-
99
-
100
-
101
-
102
-
103
-
104
-
105
-
106
-
107
-
108
-
109
-
110
-
111
-
112
-
113
-
114
-
115
-
116
-
117
-
118
-
119
-
120
-
121
-
122
-
123
-
124
-
125
-
126
-
127
-
128
-
129
-
130
-
131
-
132
-
133
-
134
-
135
-
136
-
137
-
138
-
139
-
140
-
141
-
142
-
143
-
144
-
145
-
146
-
147
-
148
-
149
-
150
-
151
-
152
-
153
-
154
-
155
-
156
-
157
-
158
-
159
-
160
-
161
-
162
-
163
-
164
-
165
-
166
-
167
-
168
-
169
-
170
-
171
-
172
-
173
-
174
-
175
-
176
-
177
-
178
-
179
-
180
-
181
-
182
-
183
-
184
-
185
-
186
-
187
-
188
-
189
-
190
-
191
-
192
-
193
-
194
-
195
-
196
-
197
-
198
-
199
-
200
-
201
-
202
-
 203
203 -
 204
204 -
 205
205 -
 206
206 -
 207
207 -
 208
208 -
 209
209 -
 210
210 -
 211
211 -
 212
212 -
 213
213 -
 214
214 -
 215
215 -
 216
216 -
 217
217 -
 218
218 -
 219
219 -
 220
220 -
 221
221 -
 222
222 -
 223
223 -
224
-
225
-
226
-
227
-
228
-
229
-
230
-
231
-
232
-
233
-
234
-
235
-
236
-
237
-
238
-
239
-
240
-
241
-
242
-
243
-
244
-
245
-
246
-
247
-
248
-
249
-
250
-
251
-
252
-
253
-
254
-
255
-
256
-
257
-
258
-
259
-
260
-
261
-
262
-
263
-
264
-
265
-
266
-
267
-
268
-
269
-
270
-
271
-
272
-
273
-
274
-
275
-
276
-
277
-
278
-
279
-
280
-
281
-
282
-
283
-
284
-
285
-
286
-
287
-
288
-
289
-
290
-
291
-
292
-
293
-
294
-
295
-
296
-
297
-
298
-
299
-
300
-
301
-
302
-
303
-
304
-
305
-
306
-
307
-
308
-
309
-
310
-
311
-
312
-
313
-
314
-
315
-
316
-
317
-
318
-
319
-
320
-
321
-
322
-
323
-
324
-
325
-
326
-
327
-
328
-
329
-
330
-
331
-
332
-
333
-
334
-
335
-
336
-
337
-
338
-
339
-
340
-
341
-
342
-
343
-
344
-
345
-
346
 |
 |

Notes
212 Consolidated
Financial
Statements
at 31 December
2012
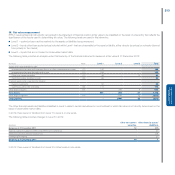
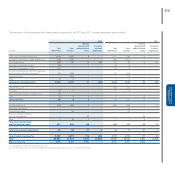
Quantitative information on interest rate risk
The manufacturing companies and treasuries of the Group make use of external funds obtained in the form of financing and invest in monetary and financial
market instruments. In addition, Group companies make sales of receivables resulting from their trading activities on a continuing basis. Changes in market
interest rates can affect the cost of the various forms of financing, including the sale of receivables, or the return on investments, and the employment of
funds, causing an impact on the level of net financial expenses incurred by the Group.
In addition, the financial services companies provide loans (mainly to customers and dealers), financing themselves using various forms of direct debt or
asset-backed financing (e.g. factoring of receivables). Where the characteristics of the variability of the interest rate applied to loans granted differ from
those of the variability of the cost of the financing obtained, changes in the current level of interest rates can affect the Operating result of those companies
and the Group as a whole.
In order to manage these risks, the Group uses interest rate derivative financial instruments, mainly interest rate swaps and forward rate agreements, when
available in the market, with the object of mitigating, under economically acceptable conditions, the potential variability of interest rates on net profit/(loss).
In assessing the potential impact of changes in interest rates, the Group separates out fixed rate financial instruments (for which the impact is assessed in
terms of fair value) from floating rate financial instruments (for which the impact is assessed in terms of cash flows).
The fixed rate financial instruments used by the Group consist principally of part of the portfolio of the financial services companies (basically customer
financing and financial leases) and part of debt (including subsidised loans and bonds).
The potential loss in fair value of fixed rate financial instruments (including the effect of interest rate derivative financial instruments) held at 31 December
2012, resulting from a hypothetical, unfavourable and instantaneous change of 10% in market interest rates, would have been approximately €100 million
(€140 million at 31 December 2011). The change over the previous year is mainly attributable to interest rate levels used as based for sensitivity analysis.
Floating rate financial instruments consist principally of cash and cash equivalents, loans provided by the financial services companies to the sales network
and part of debt. The effect of the sale of receivables is also considered in the sensitivity analysis as well as the effect of hedging derivative instruments.
A hypothetical, unfavourable and instantaneous change of 10% in short-term interest rates at 31 December 2012, applied to floating rate financial assets
and liabilities, operations for the sale of receivables and derivative financial instruments, would have caused increased net expenses before taxes, on an
annual basis, of approximately €10 million (€10 million at 31 December 2011).
This analysis is based on the assumption that there is a general and instantaneous change of 10% in interest rates across homogeneous categories. A
homogeneous category is defined on the basis of the currency in which the financial assets and liabilities are denominated.
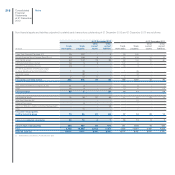
Quantitative information on commodity price risk
The Group has entered into derivative contracts for certain commodities to hedge its exposure to commodity price risk associated with buying raw materials
used in its normal operations.
In connection with the commodity price derivative contracts outstanding at 31 December 2012, a hypothetical, unfavourable and instantaneous change of
10% in the price of the commodities at that date would have caused a fair value loss of €51 million (€58 million at 31 December 2011).
Quantitative information on other risks on derivative financial instruments
As described in Note 21, the Group holds derivative financial instruments, whose value is linked to the price of listed shares (equity swaps on Fiat S.p.A. and
Fiat Industrial S.p.A. shares). Although these transactions were entered into for hedging purposes, they do not qualify for hedge accounting under IFRS. As
a consequence, the variability of the underlying values could have an effect on the Group’s net profit/(loss).
In the event of a hypothetical, unfavourable and instantaneous change of 10% in the underlying values, the potential loss in fair value of outstanding
derivative financial instruments at 31 December 2012 linked to the Fiat S.p.A. and Fiat Industrial S.p.A share price would have been approximately
€20 million (€17 million at 31 December 2011). The change over the previous year is due to the different price of the share at the end of the year
(which is used as a basis for the simulation).