Chrysler 2012 Annual Report Download - page 57
Download and view the complete annual report
Please find page 57 of the 2012 Chrysler annual report below. You can navigate through the pages in the report by either clicking on the pages listed below, or by using the keyword search tool below to find specific information within the annual report.-
 1
1 -
2
-
3
-
4
-
5
-
6
-
7
-
8
-
9
-
10
-
11
-
12
-
13
-
14
-
15
-
16
-
17
-
18
-
19
-
20
-
21
-
22
-
23
-
24
-
25
-
26
-
27
-
28
-
29
-
30
-
31
-
32
-
33
-
34
-
35
-
36
-
37
-
38
-
39
-
40
-
41
-
42
-
43
-
44
-
45
-
46
-
 47
47 -
 48
48 -
 49
49 -
 50
50 -
 51
51 -
 52
52 -
 53
53 -
 54
54 -
 55
55 -
 56
56 -
 57
57 -
 58
58 -
 59
59 -
 60
60 -
 61
61 -
 62
62 -
 63
63 -
 64
64 -
 65
65 -
 66
66 -
 67
67 -
68
-
69
-
70
-
71
-
72
-
73
-
74
-
75
-
76
-
77
-
78
-
79
-
80
-
81
-
82
-
83
-
84
-
85
-
86
-
87
-
88
-
89
-
90
-
91
-
92
-
93
-
94
-
95
-
96
-
97
-
98
-
99
-
100
-
101
-
102
-
103
-
104
-
105
-
106
-
107
-
108
-
109
-
110
-
111
-
112
-
113
-
114
-
115
-
116
-
117
-
118
-
119
-
120
-
121
-
122
-
123
-
124
-
125
-
126
-
127
-
128
-
129
-
130
-
131
-
132
-
133
-
134
-
135
-
136
-
137
-
138
-
139
-
140
-
141
-
142
-
143
-
144
-
145
-
146
-
147
-
148
-
149
-
150
-
151
-
152
-
153
-
154
-
155
-
156
-
157
-
158
-
159
-
160
-
161
-
162
-
163
-
164
-
165
-
166
-
167
-
168
-
169
-
170
-
171
-
172
-
173
-
174
-
175
-
176
-
177
-
178
-
179
-
180
-
181
-
182
-
183
-
184
-
185
-
186
-
187
-
188
-
189
-
190
-
191
-
192
-
193
-
194
-
195
-
196
-
197
-
198
-
199
-
200
-
201
-
202
-
203
-
204
-
205
-
206
-
207
-
208
-
209
-
210
-
211
-
212
-
213
-
214
-
215
-
216
-
217
-
218
-
219
-
220
-
221
-
222
-
223
-
224
-
225
-
226
-
227
-
228
-
229
-
230
-
231
-
232
-
233
-
234
-
235
-
236
-
237
-
238
-
239
-
240
-
241
-
242
-
243
-
244
-
245
-
246
-
247
-
248
-
249
-
250
-
251
-
252
-
253
-
254
-
255
-
256
-
257
-
258
-
259
-
260
-
261
-
262
-
263
-
264
-
265
-
266
-
267
-
268
-
269
-
270
-
271
-
272
-
273
-
274
-
275
-
276
-
277
-
278
-
279
-
280
-
281
-
282
-
283
-
284
-
285
-
286
-
287
-
288
-
289
-
290
-
291
-
292
-
293
-
294
-
295
-
296
-
297
-
298
-
299
-
300
-
301
-
302
-
303
-
304
-
305
-
306
-
307
-
308
-
309
-
310
-
311
-
312
-
313
-
314
-
315
-
316
-
317
-
318
-
319
-
320
-
321
-
322
-
323
-
324
-
325
-
326
-
327
-
328
-
329
-
330
-
331
-
332
-
333
-
334
-
335
-
336
-
337
-
338
-
339
-
340
-
341
-
342
-
343
-
344
-
345
-
346
 |
 |

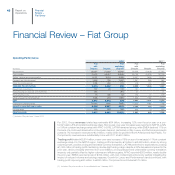
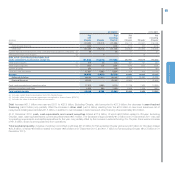
56
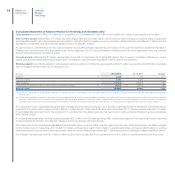
Industrial Activities and Financial Services – Results for 2012
The following tables provide a breakdown of the consolidated statements of income, financial position and cash flows between “Industrial Activities” and
“Financial Services”. Financial Services includes companies that provide retail and dealer finance, leasing and rental services in LATAM, APAC, and EMEA
and for Ferrari worldwide.
Financial Services also includes FGA Capital (the joint venture between Fiat Group Automobiles and Crédit Agricole), which is accounted for under the
equity method.
Basis of analysis
The segmentation between Industrial Activities and Financial Services represents a sub-consolidation prepared on the basis of the core activities of each
Group company.
Investments held by companies belonging to one segment in companies included in the other segment are accounted for under the equity method. To
provide a more meaningful presentation of net profit, the results of investments accounted for in this manner are classified in the income statement under
Result from intersegment investments.
The holding companies (Fiat S.p.A., Fiat Gestione Partecipazioni S.p.A., Fiat North America LLC and Fiat Partecipazioni S.p.A.) are classified under Industrial
Activities.
The sub-consolidation of Industrial Activities also includes companies that provide centralized treasury services for Fiat excluding Chrysler (i.e., raising funds
in the market and financing Group companies, with the exception of Chrysler Group LLC and its subsidiaries). Those activities do not, however, include
offering financing to third parties.
N.B.: All Chrysler Group activities are included under Industrial Activities and Chrysler Group’s treasury activities (including funding and cash management)
are managed separately from the rest of Fiat Group.
Operating Performance by Activity
2012 2011 (*)
(€ million) Consolidated
Industrial
Activities
Financial
Services Consolidated
Industrial
Activities
Financial
Services
Net revenues 83,957 83,660 394 59,559 59,297 358
Cost of sales 71,474 71,300 271 50,704 50,545 255
Selling, general and administrative 6,731 6,687 44 5,047 5,009 38
Research and development 1,835 1,835 - 1,367 1,367 -
Other income/(expense) (103) (114) 11 (49) (56) 7
TRADING PROFIT/(LOSS) 3,814 3,724 90 2,392 2,320 72
Result from investments (**) 107 24 83 131 54 77
Gains/(losses) on disposal of investments (91) (91) - 21 21 -
Restructuring costs 15 15 - 102 102 -
Other unusual income/(expense) (138) (138) - 1,025 1,026 (1)
EBIT 3,677 3,504 173 3,467 3,319 148
Financial income/(expense) (1,641) (1,641) - (1,282) (1,282) -
PROFIT/(LOSS) BEFORE TAXES 2,036 1,863 173 2,185 2,037 148
Income taxes 625 596 29 534 517 17
PROFIT/(LOSS) 1,411 1,267 144 1,651 1,520 131
Result from intersegment investments - 144 - - 131 -
PROFIT/(LOSS) 1,411 1,411 144 1,651 1,651 131
(*) Includes Chrysler from 1 June 2011.
(**) Includes income from investments, as well as impairment (losses)/reversals on non-intersegment investments accounted for under the equity method.
Financial
Review –
Fiat Group
Report on
Operations