Chrysler 2012 Annual Report Download - page 66
Download and view the complete annual report
Please find page 66 of the 2012 Chrysler annual report below. You can navigate through the pages in the report by either clicking on the pages listed below, or by using the keyword search tool below to find specific information within the annual report.-
 1
1 -
2
-
3
-
4
-
5
-
6
-
7
-
8
-
9
-
10
-
11
-
12
-
13
-
14
-
15
-
16
-
17
-
18
-
19
-
20
-
21
-
22
-
23
-
24
-
25
-
26
-
27
-
28
-
29
-
30
-
31
-
32
-
33
-
34
-
35
-
36
-
37
-
38
-
39
-
40
-
41
-
42
-
43
-
44
-
45
-
46
-
47
-
48
-
49
-
50
-
51
-
52
-
53
-
54
-
55
-
 56
56 -
 57
57 -
 58
58 -
 59
59 -
 60
60 -
 61
61 -
 62
62 -
 63
63 -
 64
64 -
 65
65 -
 66
66 -
 67
67 -
 68
68 -
 69
69 -
 70
70 -
 71
71 -
 72
72 -
 73
73 -
 74
74 -
 75
75 -
 76
76 -
77
-
78
-
79
-
80
-
81
-
82
-
83
-
84
-
85
-
86
-
87
-
88
-
89
-
90
-
91
-
92
-
93
-
94
-
95
-
96
-
97
-
98
-
99
-
100
-
101
-
102
-
103
-
104
-
105
-
106
-
107
-
108
-
109
-
110
-
111
-
112
-
113
-
114
-
115
-
116
-
117
-
118
-
119
-
120
-
121
-
122
-
123
-
124
-
125
-
126
-
127
-
128
-
129
-
130
-
131
-
132
-
133
-
134
-
135
-
136
-
137
-
138
-
139
-
140
-
141
-
142
-
143
-
144
-
145
-
146
-
147
-
148
-
149
-
150
-
151
-
152
-
153
-
154
-
155
-
156
-
157
-
158
-
159
-
160
-
161
-
162
-
163
-
164
-
165
-
166
-
167
-
168
-
169
-
170
-
171
-
172
-
173
-
174
-
175
-
176
-
177
-
178
-
179
-
180
-
181
-
182
-
183
-
184
-
185
-
186
-
187
-
188
-
189
-
190
-
191
-
192
-
193
-
194
-
195
-
196
-
197
-
198
-
199
-
200
-
201
-
202
-
203
-
204
-
205
-
206
-
207
-
208
-
209
-
210
-
211
-
212
-
213
-
214
-
215
-
216
-
217
-
218
-
219
-
220
-
221
-
222
-
223
-
224
-
225
-
226
-
227
-
228
-
229
-
230
-
231
-
232
-
233
-
234
-
235
-
236
-
237
-
238
-
239
-
240
-
241
-
242
-
243
-
244
-
245
-
246
-
247
-
248
-
249
-
250
-
251
-
252
-
253
-
254
-
255
-
256
-
257
-
258
-
259
-
260
-
261
-
262
-
263
-
264
-
265
-
266
-
267
-
268
-
269
-
270
-
271
-
272
-
273
-
274
-
275
-
276
-
277
-
278
-
279
-
280
-
281
-
282
-
283
-
284
-
285
-
286
-
287
-
288
-
289
-
290
-
291
-
292
-
293
-
294
-
295
-
296
-
297
-
298
-
299
-
300
-
301
-
302
-
303
-
304
-
305
-
306
-
307
-
308
-
309
-
310
-
311
-
312
-
313
-
314
-
315
-
316
-
317
-
318
-
319
-
320
-
321
-
322
-
323
-
324
-
325
-
326
-
327
-
328
-
329
-
330
-
331
-
332
-
333
-
334
-
335
-
336
-
337
-
338
-
339
-
340
-
341
-
342
-
343
-
344
-
345
-
346
 |
 |

65
Report on Operations
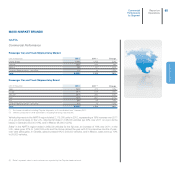
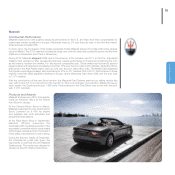
MASS-MARKET BRANDS
NAFTA
Commercial Performance
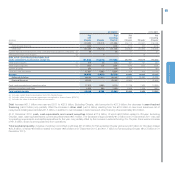
Passenger Car and Truck Shipments by Market
(units in thousands) 2012 2011 (*) Change
United States 1,748 1,453 20%
Canada 255 233 9%
Mexico 98 81 22%
Contract Manufacturing (**) and other 14 16 -13%
Total 2,115 1,783 19%
Passenger Car and Truck Shipments by Brand
(units in thousands) 2012 2011 (*) Change
Jeep 548 479 14%
Dodge 717 619 16%
Chrysler 347 280 24%
Ram 423 351 21%
Fiat 66 38 74%
Contract Manufacturing (**) and other 14 16 -13%
Total 2,115 1,783 19%
(*) Pro-forma calculation including Chrysler shipments as if consolidated from 1 January 2011.
(**) Vehicles produced for other automakers, including Fiat Group Automobiles.
Vehicle shipments in the NAFTA region totaled 2,115,000 units in 2012, representing a 19% increase over 2011
on a pro-forma basis. In the U.S., shipments totaled 1,748,000 vehicles (up 20% over 2011 on a pro-forma
basis), in Canada 255,000 (+9%), and in Mexico 98,000 (+22%).
Sales2 in the NAFTA region totaled 1,989,000 vehicles for the full year, an increase of 18% over 2011. In the
U.S., sales grew 21% to 1,652,000 units and the Group closed the year with 33 consecutive months of year-
over-year sales gains. In Canada, sales increased 6% to 244,000 vehicles, and in Mexico, sales were up 10%
to 93,000 vehicles.
(2) “Sales” represent sales to end customers as reported by the Chrysler dealer network.
Commercial
Performance
by Segment
Report on
Operations