Chrysler 2012 Annual Report Download - page 173
Download and view the complete annual report
Please find page 173 of the 2012 Chrysler annual report below. You can navigate through the pages in the report by either clicking on the pages listed below, or by using the keyword search tool below to find specific information within the annual report.-
 1
1 -
2
-
3
-
4
-
5
-
6
-
7
-
8
-
9
-
10
-
11
-
12
-
13
-
14
-
15
-
16
-
17
-
18
-
19
-
20
-
21
-
22
-
23
-
24
-
25
-
26
-
27
-
28
-
29
-
30
-
31
-
32
-
33
-
34
-
35
-
36
-
37
-
38
-
39
-
40
-
41
-
42
-
43
-
44
-
45
-
46
-
47
-
48
-
49
-
50
-
51
-
52
-
53
-
54
-
55
-
56
-
57
-
58
-
59
-
60
-
61
-
62
-
63
-
64
-
65
-
66
-
67
-
68
-
69
-
70
-
71
-
72
-
73
-
74
-
75
-
76
-
77
-
78
-
79
-
80
-
81
-
82
-
83
-
84
-
85
-
86
-
87
-
88
-
89
-
90
-
91
-
92
-
93
-
94
-
95
-
96
-
97
-
98
-
99
-
100
-
101
-
102
-
103
-
104
-
105
-
106
-
107
-
108
-
109
-
110
-
111
-
112
-
113
-
114
-
115
-
116
-
117
-
118
-
119
-
120
-
121
-
122
-
123
-
124
-
125
-
126
-
127
-
128
-
129
-
130
-
131
-
132
-
133
-
134
-
135
-
136
-
137
-
138
-
139
-
140
-
141
-
142
-
143
-
144
-
145
-
146
-
147
-
148
-
149
-
150
-
151
-
152
-
153
-
154
-
155
-
156
-
157
-
158
-
159
-
160
-
161
-
162
-
 163
163 -
 164
164 -
 165
165 -
 166
166 -
 167
167 -
 168
168 -
 169
169 -
 170
170 -
 171
171 -
 172
172 -
 173
173 -
 174
174 -
 175
175 -
 176
176 -
 177
177 -
 178
178 -
 179
179 -
 180
180 -
 181
181 -
 182
182 -
 183
183 -
184
-
185
-
186
-
187
-
188
-
189
-
190
-
191
-
192
-
193
-
194
-
195
-
196
-
197
-
198
-
199
-
200
-
201
-
202
-
203
-
204
-
205
-
206
-
207
-
208
-
209
-
210
-
211
-
212
-
213
-
214
-
215
-
216
-
217
-
218
-
219
-
220
-
221
-
222
-
223
-
224
-
225
-
226
-
227
-
228
-
229
-
230
-
231
-
232
-
233
-
234
-
235
-
236
-
237
-
238
-
239
-
240
-
241
-
242
-
243
-
244
-
245
-
246
-
247
-
248
-
249
-
250
-
251
-
252
-
253
-
254
-
255
-
256
-
257
-
258
-
259
-
260
-
261
-
262
-
263
-
264
-
265
-
266
-
267
-
268
-
269
-
270
-
271
-
272
-
273
-
274
-
275
-
276
-
277
-
278
-
279
-
280
-
281
-
282
-
283
-
284
-
285
-
286
-
287
-
288
-
289
-
290
-
291
-
292
-
293
-
294
-
295
-
296
-
297
-
298
-
299
-
300
-
301
-
302
-
303
-
304
-
305
-
306
-
307
-
308
-
309
-
310
-
311
-
312
-
313
-
314
-
315
-
316
-
317
-
318
-
319
-
320
-
321
-
322
-
323
-
324
-
325
-
326
-
327
-
328
-
329
-
330
-
331
-
332
-
333
-
334
-
335
-
336
-
337
-
338
-
339
-
340
-
341
-
342
-
343
-
344
-
345
-
346
 |
 |
Notes
172 Consolidated
Financial
Statements
at 31 December
2012
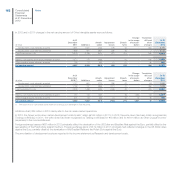
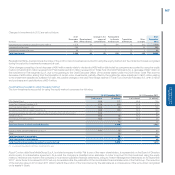
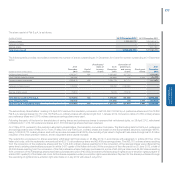
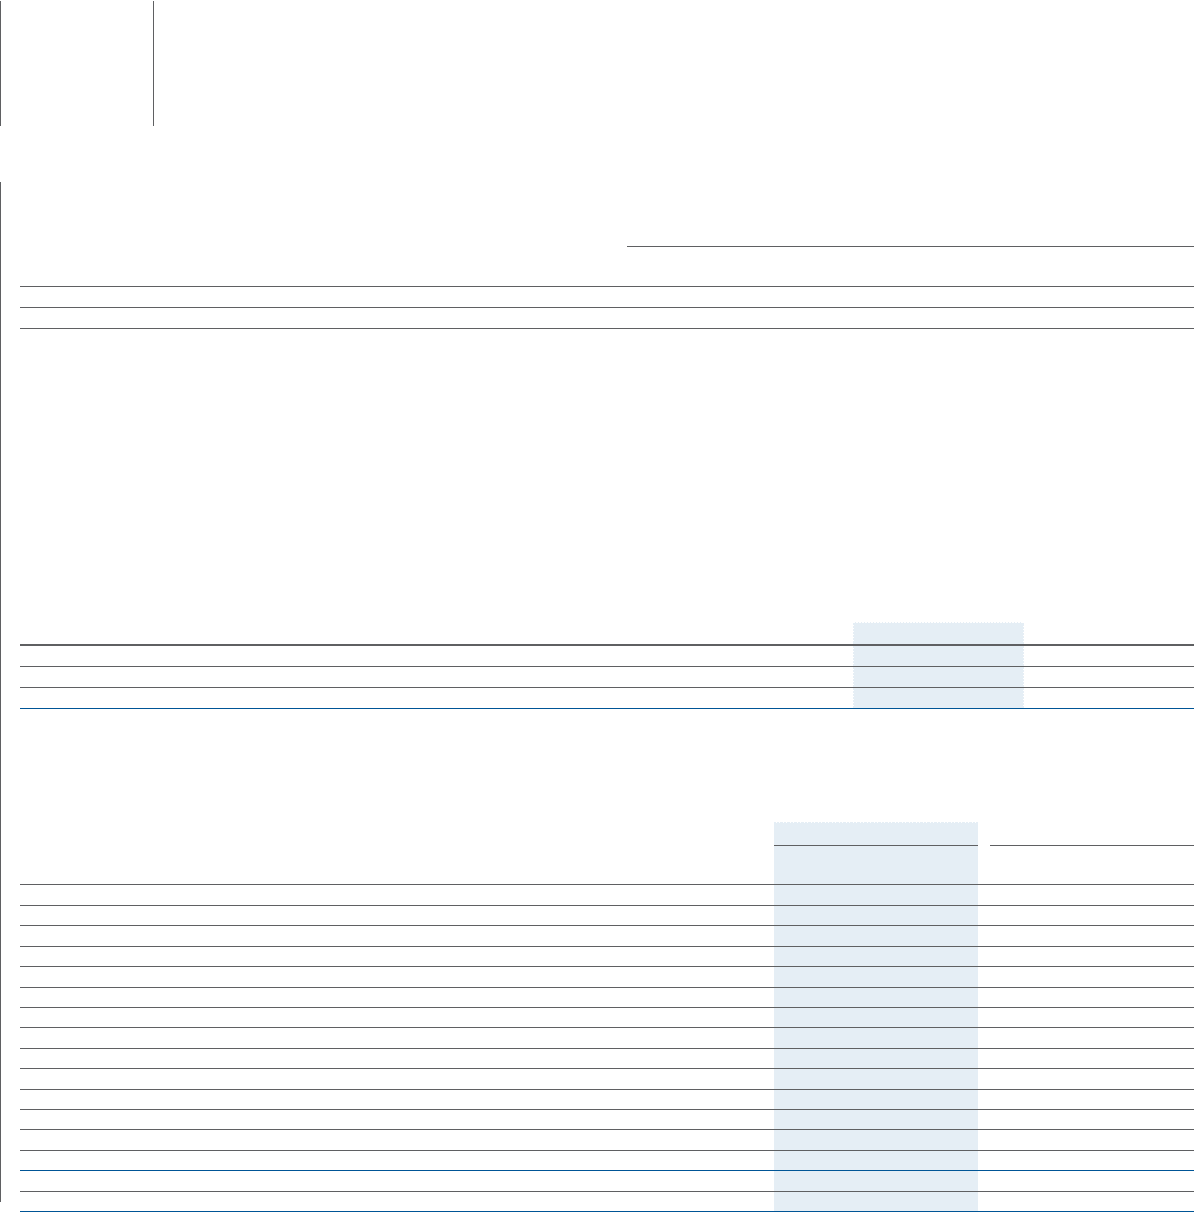
At 31 December 2012, the carrying amount of transferred financial assets not derecognised and the related liabilities was as follows:
At 31 December 2012
(€ million)
Trade
receivables
Receivables from
financing activities
Current tax
receivables Total
Carrying amount of assets trasferred and not derecognised 9 405 35 449
Carrying amount of the related liabilities 9 405 35 449
At 31 December 2012, the Group had receivables and bills due after that date which had been transferred without recourse and which were accordingly
derecognised amounting to €3,631 million (€3,858 million at 31 December 2011). The transfers related to trade receivables and other receivables for
€2,932 million (€3,031 million at 31 December 2011) and financial receivables for €699 million (€827 million at 31 December 2011). These amounts include
receivables of €2,179 million (€2,495 million at 31 December 2011), mainly due from the sales network, transferred to jointly controlled financial services
companies (FGA Capital).
At 31 December 2011, Total Current receivables included receivables sold and financed through factoring transactions of €679 million which do not meet
IAS 39 derecognition requirements.
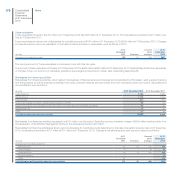
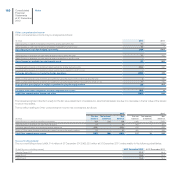
20. Current securities
Current securities consist of short-term or marketable securities which represent temporary investments, but which do not satisfy all the requirements for
being classified as cash equivalents. In particular:
(€ million) At 31 December 2012 At 31 December 2011
Current securities available-for-sale 83 52
Current securities held-for-trading 173 147
Total Current securities 256 199
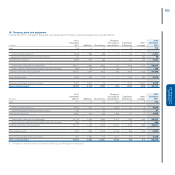
21. Other financial assets and Other financial liabilities
These line items refer to derivative financial instruments and in particular to their measurement at fair value at the balance sheet date and to any cash
collateral.
At 31 December 2012 At 31 December 2011
(€ million)
Positive
fair value
Negative
fair value
Positive
fair value
Negative
fair value
Fair value hedges
Interest rate risk - Interest rate swaps 121 - 216 -
Interest rate and currency risk - Combined interest rate and currency swaps 1 (1) 1 (2)
Total Fair value hedges 122 (1) 217 (2)
Cash flow hedges
Currency risks - Forward contracts, Currency swaps and Currency options 108 (75) 91 (258)
Interest rate risk - Interest rate swaps - (8) - (5)
Interest rate and currency risk - Combined interest rate and currency swaps 7 (9) - -
Commodity price risk – Commodity swap 10 (6) 1 (42)
Total Cash flow hedges 125 (98) 92 (305)
Derivatives for trading 254 (102) 174 (122)
Fair value of derivative instruments 501 (201) 483 (429)
Cash collaterals 18 - 74 -
Other financial assets/(liabilities) 519 (201) 557 (429)