Chrysler 2012 Annual Report Download - page 129
Download and view the complete annual report
Please find page 129 of the 2012 Chrysler annual report below. You can navigate through the pages in the report by either clicking on the pages listed below, or by using the keyword search tool below to find specific information within the annual report.-
 1
1 -
2
-
3
-
4
-
5
-
6
-
7
-
8
-
9
-
10
-
11
-
12
-
13
-
14
-
15
-
16
-
17
-
18
-
19
-
20
-
21
-
22
-
23
-
24
-
25
-
26
-
27
-
28
-
29
-
30
-
31
-
32
-
33
-
34
-
35
-
36
-
37
-
38
-
39
-
40
-
41
-
42
-
43
-
44
-
45
-
46
-
47
-
48
-
49
-
50
-
51
-
52
-
53
-
54
-
55
-
56
-
57
-
58
-
59
-
60
-
61
-
62
-
63
-
64
-
65
-
66
-
67
-
68
-
69
-
70
-
71
-
72
-
73
-
74
-
75
-
76
-
77
-
78
-
79
-
80
-
81
-
82
-
83
-
84
-
85
-
86
-
87
-
88
-
89
-
90
-
91
-
92
-
93
-
94
-
95
-
96
-
97
-
98
-
99
-
100
-
101
-
102
-
103
-
104
-
105
-
106
-
107
-
108
-
109
-
110
-
111
-
112
-
113
-
114
-
115
-
116
-
117
-
118
-
 119
119 -
 120
120 -
 121
121 -
 122
122 -
 123
123 -
 124
124 -
 125
125 -
 126
126 -
 127
127 -
 128
128 -
 129
129 -
 130
130 -
 131
131 -
 132
132 -
 133
133 -
 134
134 -
 135
135 -
 136
136 -
 137
137 -
 138
138 -
 139
139 -
140
-
141
-
142
-
143
-
144
-
145
-
146
-
147
-
148
-
149
-
150
-
151
-
152
-
153
-
154
-
155
-
156
-
157
-
158
-
159
-
160
-
161
-
162
-
163
-
164
-
165
-
166
-
167
-
168
-
169
-
170
-
171
-
172
-
173
-
174
-
175
-
176
-
177
-
178
-
179
-
180
-
181
-
182
-
183
-
184
-
185
-
186
-
187
-
188
-
189
-
190
-
191
-
192
-
193
-
194
-
195
-
196
-
197
-
198
-
199
-
200
-
201
-
202
-
203
-
204
-
205
-
206
-
207
-
208
-
209
-
210
-
211
-
212
-
213
-
214
-
215
-
216
-
217
-
218
-
219
-
220
-
221
-
222
-
223
-
224
-
225
-
226
-
227
-
228
-
229
-
230
-
231
-
232
-
233
-
234
-
235
-
236
-
237
-
238
-
239
-
240
-
241
-
242
-
243
-
244
-
245
-
246
-
247
-
248
-
249
-
250
-
251
-
252
-
253
-
254
-
255
-
256
-
257
-
258
-
259
-
260
-
261
-
262
-
263
-
264
-
265
-
266
-
267
-
268
-
269
-
270
-
271
-
272
-
273
-
274
-
275
-
276
-
277
-
278
-
279
-
280
-
281
-
282
-
283
-
284
-
285
-
286
-
287
-
288
-
289
-
290
-
291
-
292
-
293
-
294
-
295
-
296
-
297
-
298
-
299
-
300
-
301
-
302
-
303
-
304
-
305
-
306
-
307
-
308
-
309
-
310
-
311
-
312
-
313
-
314
-
315
-
316
-
317
-
318
-
319
-
320
-
321
-
322
-
323
-
324
-
325
-
326
-
327
-
328
-
329
-
330
-
331
-
332
-
333
-
334
-
335
-
336
-
337
-
338
-
339
-
340
-
341
-
342
-
343
-
344
-
345
-
346
 |
 |
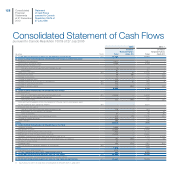
128 Consolidated
Financial
Statements
at 31 December
2012
Statement
of Cash Flows
pursuant to Consob
Resolution 15519 of
27 July 2006
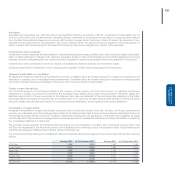
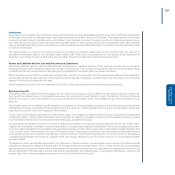
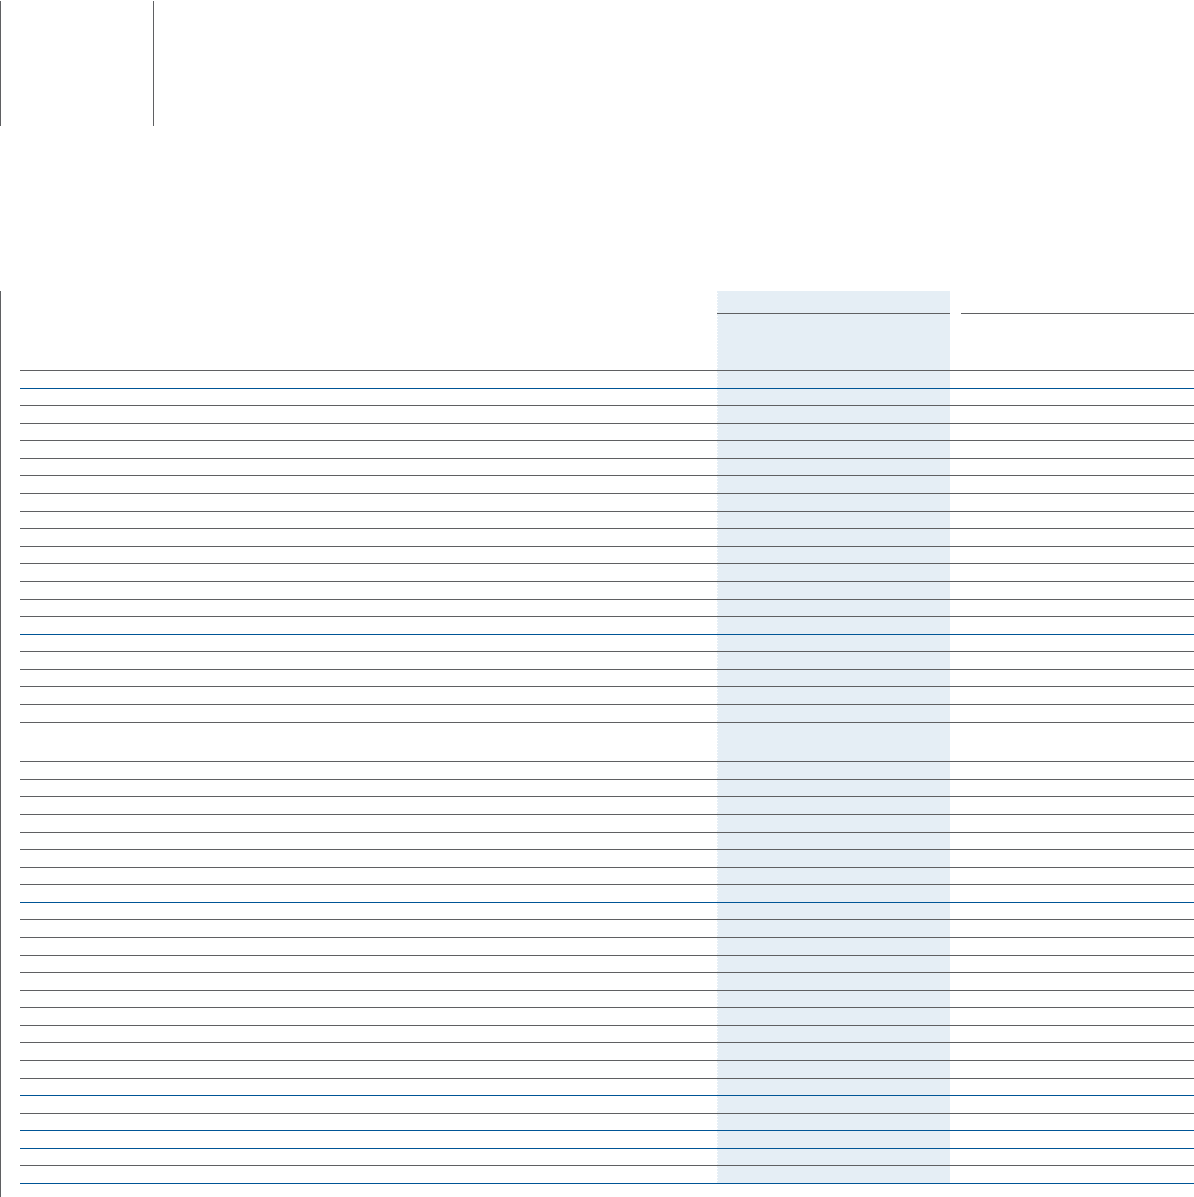
Consolidated Statement of Cash Flows
pursuant to Consob Resolution 15519 of 27 July 2006
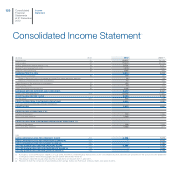
2012 2011 (*)
(€ million) Note Total
of which
Related Parties
(Note 37) Total
of which
Related Parties
(Note 37)
A) CASH AND CASH EQUIVALENTS AT BEGINNING OF THE YEAR (22) 17,526 11,967
B) CASH FLOWS FROM/(USED IN) OPERATING ACTIVITIES DURING THE YEAR:
Profit/(loss) for the period 1,411 1,651 -
Amortisation and depreciation 4,134 3,358 -
(Gains)/losses on disposal of:
Property, plant and equipment and intangible assets 14 21 -
Investments 91 (21) -
Other non-cash items (31) 47 9(1,106) 12
Dividends received 89 89 105 105
Change in provisions 77 1(116) 124
Change in deferred taxes (72) -(19) -
Change in items due to buy-back commitments (31) (51) 2(62) 9
Change in operating lease items (31) (10) -(28) -
Change in working capital 714 (90) 1,412 225
TOTAL 6,444 5,195
C) CASH FLOWS FROM/(USED IN) INVESTING ACTIVITIES:
Investments in:
Property, plant and equipment and intangible assets (31) (7,534) -(5,528) -
Investments in consolidated subsidiaries --(22) -
Other investments (24) (20) (120) (76)
Cash and cash equivalents from consolidation of Chrysler, net of consideration paid
for the additional 16% ownership interest (31) --5,624 -
Proceeds from the sale of:
Property, plant and equipment and intangible assets 118 -324 -
Investments in consolidated subsidiaries --29 15
Other investments 21 -96 80
Net change in receivables from financing activities (24) (7) (1,218) (74)
Change in current securities (64) -(14) -
Other changes (30) -(29) -
TOTAL (7,537) (858)
D) CASH FLOWS FROM/(USED IN) FINANCING ACTIVITIES:
Issuance of bonds 2,535 -2,500 -
Repayment of bonds (1,450) -(2,448) -
Issuance of other medium-term borrowings 1,925 -2,149 -
Repayment of other medium-term borrowings (1,528) -(3,895) -
Changes in net financial receivables from Fiat Industrial group --2,761 2,761
Net change in other financial payables and other financial assets/liabilities 197 (34) 143 33
Increase in share capital 22 -41 -
Dividends paid (58) (11) (181) (40)
(Purchase)/sale of ownership interests in subsidiaries (31) --(438) -
TOTAL 1,643 632
Translation exchange differences (419) 590
E) TOTAL CHANGE IN CASH AND CASH EQUIVALENTS 131 5,559
F) CASH AND CASH EQUIVALENTS AT END OF THE YEAR (22) 17,657 17,526
of which: Cash and cash equivalents included as Assets held for --
G) CASH AND CASH EQUIVALENTS AT END OF THE YEAR AS REPORTED (22) 17,657 17,526
(*) Cash flows for 2011 include the consolidation of Chrysler from 1 June 2011.