Chrysler 2012 Annual Report Download - page 51
Download and view the complete annual report
Please find page 51 of the 2012 Chrysler annual report below. You can navigate through the pages in the report by either clicking on the pages listed below, or by using the keyword search tool below to find specific information within the annual report.-
 1
1 -
2
-
3
-
4
-
5
-
6
-
7
-
8
-
9
-
10
-
11
-
12
-
13
-
14
-
15
-
16
-
17
-
18
-
19
-
20
-
21
-
22
-
23
-
24
-
25
-
26
-
27
-
28
-
29
-
30
-
31
-
32
-
33
-
34
-
35
-
36
-
37
-
38
-
39
-
40
-
 41
41 -
 42
42 -
 43
43 -
 44
44 -
 45
45 -
 46
46 -
 47
47 -
 48
48 -
 49
49 -
 50
50 -
 51
51 -
 52
52 -
 53
53 -
 54
54 -
 55
55 -
 56
56 -
 57
57 -
 58
58 -
 59
59 -
 60
60 -
 61
61 -
62
-
63
-
64
-
65
-
66
-
67
-
68
-
69
-
70
-
71
-
72
-
73
-
74
-
75
-
76
-
77
-
78
-
79
-
80
-
81
-
82
-
83
-
84
-
85
-
86
-
87
-
88
-
89
-
90
-
91
-
92
-
93
-
94
-
95
-
96
-
97
-
98
-
99
-
100
-
101
-
102
-
103
-
104
-
105
-
106
-
107
-
108
-
109
-
110
-
111
-
112
-
113
-
114
-
115
-
116
-
117
-
118
-
119
-
120
-
121
-
122
-
123
-
124
-
125
-
126
-
127
-
128
-
129
-
130
-
131
-
132
-
133
-
134
-
135
-
136
-
137
-
138
-
139
-
140
-
141
-
142
-
143
-
144
-
145
-
146
-
147
-
148
-
149
-
150
-
151
-
152
-
153
-
154
-
155
-
156
-
157
-
158
-
159
-
160
-
161
-
162
-
163
-
164
-
165
-
166
-
167
-
168
-
169
-
170
-
171
-
172
-
173
-
174
-
175
-
176
-
177
-
178
-
179
-
180
-
181
-
182
-
183
-
184
-
185
-
186
-
187
-
188
-
189
-
190
-
191
-
192
-
193
-
194
-
195
-
196
-
197
-
198
-
199
-
200
-
201
-
202
-
203
-
204
-
205
-
206
-
207
-
208
-
209
-
210
-
211
-
212
-
213
-
214
-
215
-
216
-
217
-
218
-
219
-
220
-
221
-
222
-
223
-
224
-
225
-
226
-
227
-
228
-
229
-
230
-
231
-
232
-
233
-
234
-
235
-
236
-
237
-
238
-
239
-
240
-
241
-
242
-
243
-
244
-
245
-
246
-
247
-
248
-
249
-
250
-
251
-
252
-
253
-
254
-
255
-
256
-
257
-
258
-
259
-
260
-
261
-
262
-
263
-
264
-
265
-
266
-
267
-
268
-
269
-
270
-
271
-
272
-
273
-
274
-
275
-
276
-
277
-
278
-
279
-
280
-
281
-
282
-
283
-
284
-
285
-
286
-
287
-
288
-
289
-
290
-
291
-
292
-
293
-
294
-
295
-
296
-
297
-
298
-
299
-
300
-
301
-
302
-
303
-
304
-
305
-
306
-
307
-
308
-
309
-
310
-
311
-
312
-
313
-
314
-
315
-
316
-
317
-
318
-
319
-
320
-
321
-
322
-
323
-
324
-
325
-
326
-
327
-
328
-
329
-
330
-
331
-
332
-
333
-
334
-
335
-
336
-
337
-
338
-
339
-
340
-
341
-
342
-
343
-
344
-
345
-
346
 |
 |

50
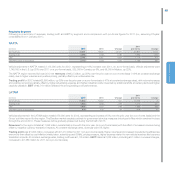
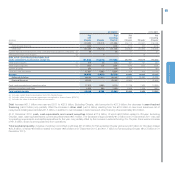
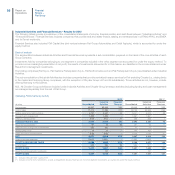
APAC
(€ million) 2012 2011 Change
2011
pro-forma Change
Net revenues 3,128 1,513 1,615 2,086 1,042
Trading profit 260 88 172 144 116
EBIT 255 63 192 119 136
Shipments (units in thousands) 103 53 50 74 29
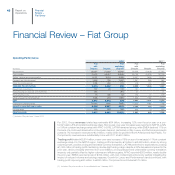
Vehicle shipments in the APAC region (excluding JVs) totaled approximately 103,000 units for 2012, up 39% over the prior year (on a pro-forma basis).
Revenues in the APAC region totaled €3,128 million, up 50% (+39% at constant exchange rates) over 2011 on a pro-forma basis, primarily driven by the
strong performance of the Jeep brand.
Trading profit was €260 million, nearly double the prior year, benefiting primarily from volume growth and a favorable currency translation impact
(approximately €30 million). EBIT, which also reflects the contribution from joint ventures, totaled €255 million compared to €119 million in 2011 (on a
pro-forma basis).
EMEA
(€ million) 2012 2011 Change
2011
pro-forma Change
Net revenues 17,800 19,591 -1,791 20,078 -2,278
Trading profit/(loss) (704) (557) -147 (512) -192
EBIT (738) (941) 203 (897) 159
Shipments (units in thousands) 1,012 1,166 -154 1,180 -168
Passenger car and LCV shipments in the EMEA region totaled 1,012,000 units for the year, a decrease of 14% over 2011 (on a pro-forma basis).
EMEA closed the year with revenues of €17.8 billion, a decrease of 11% over 2011 (on a pro-forma basis) attributable primarily to the contraction in
volumes.
There was a trading loss of €704 million (€512 million loss for 2011 on a pro-forma basis), with negative volume and price effects being only partially
offset by industrial efficiencies, World Class Manufacturing synergies and benefits from cost containment actions. There was an EBIT loss of €738 million,
including €194 million in unusual charges, compared to a loss of €897 million for 2011 on a pro-forma basis (including €544 million in unusual charges).
Investments contributed net income of €160 million (€160 million in 2011).
Financial
Review –
Fiat Group
Report on
Operations