Chrysler 2012 Annual Report Download - page 50
Download and view the complete annual report
Please find page 50 of the 2012 Chrysler annual report below. You can navigate through the pages in the report by either clicking on the pages listed below, or by using the keyword search tool below to find specific information within the annual report.-
 1
1 -
2
-
3
-
4
-
5
-
6
-
7
-
8
-
9
-
10
-
11
-
12
-
13
-
14
-
15
-
16
-
17
-
18
-
19
-
20
-
21
-
22
-
23
-
24
-
25
-
26
-
27
-
28
-
29
-
30
-
31
-
32
-
33
-
34
-
35
-
36
-
37
-
38
-
39
-
 40
40 -
 41
41 -
 42
42 -
 43
43 -
 44
44 -
 45
45 -
 46
46 -
 47
47 -
 48
48 -
 49
49 -
 50
50 -
 51
51 -
 52
52 -
 53
53 -
 54
54 -
 55
55 -
 56
56 -
 57
57 -
 58
58 -
 59
59 -
 60
60 -
61
-
62
-
63
-
64
-
65
-
66
-
67
-
68
-
69
-
70
-
71
-
72
-
73
-
74
-
75
-
76
-
77
-
78
-
79
-
80
-
81
-
82
-
83
-
84
-
85
-
86
-
87
-
88
-
89
-
90
-
91
-
92
-
93
-
94
-
95
-
96
-
97
-
98
-
99
-
100
-
101
-
102
-
103
-
104
-
105
-
106
-
107
-
108
-
109
-
110
-
111
-
112
-
113
-
114
-
115
-
116
-
117
-
118
-
119
-
120
-
121
-
122
-
123
-
124
-
125
-
126
-
127
-
128
-
129
-
130
-
131
-
132
-
133
-
134
-
135
-
136
-
137
-
138
-
139
-
140
-
141
-
142
-
143
-
144
-
145
-
146
-
147
-
148
-
149
-
150
-
151
-
152
-
153
-
154
-
155
-
156
-
157
-
158
-
159
-
160
-
161
-
162
-
163
-
164
-
165
-
166
-
167
-
168
-
169
-
170
-
171
-
172
-
173
-
174
-
175
-
176
-
177
-
178
-
179
-
180
-
181
-
182
-
183
-
184
-
185
-
186
-
187
-
188
-
189
-
190
-
191
-
192
-
193
-
194
-
195
-
196
-
197
-
198
-
199
-
200
-
201
-
202
-
203
-
204
-
205
-
206
-
207
-
208
-
209
-
210
-
211
-
212
-
213
-
214
-
215
-
216
-
217
-
218
-
219
-
220
-
221
-
222
-
223
-
224
-
225
-
226
-
227
-
228
-
229
-
230
-
231
-
232
-
233
-
234
-
235
-
236
-
237
-
238
-
239
-
240
-
241
-
242
-
243
-
244
-
245
-
246
-
247
-
248
-
249
-
250
-
251
-
252
-
253
-
254
-
255
-
256
-
257
-
258
-
259
-
260
-
261
-
262
-
263
-
264
-
265
-
266
-
267
-
268
-
269
-
270
-
271
-
272
-
273
-
274
-
275
-
276
-
277
-
278
-
279
-
280
-
281
-
282
-
283
-
284
-
285
-
286
-
287
-
288
-
289
-
290
-
291
-
292
-
293
-
294
-
295
-
296
-
297
-
298
-
299
-
300
-
301
-
302
-
303
-
304
-
305
-
306
-
307
-
308
-
309
-
310
-
311
-
312
-
313
-
314
-
315
-
316
-
317
-
318
-
319
-
320
-
321
-
322
-
323
-
324
-
325
-
326
-
327
-
328
-
329
-
330
-
331
-
332
-
333
-
334
-
335
-
336
-
337
-
338
-
339
-
340
-
341
-
342
-
343
-
344
-
345
-
346
 |
 |

49
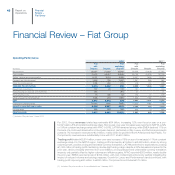
Report on Operations
Results by Segment
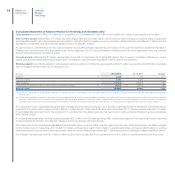
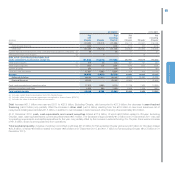
Following is a summary of revenues, trading profit and EBIT by segment and a comparison with pro-forma figures for 2011 (i.e., assuming Chrysler
consolidated from 1 January 2011).
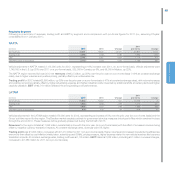
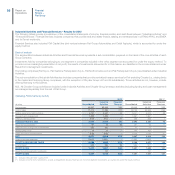
NAFTA
(€ million) 2012 2011 Change
2011
pro-forma Change
Net revenues 43,521 19,830 23,691 33,800 9,721
Trading profit 2,693 1,008 1,685 1,693 1,000
EBIT 2,741 1,087 1,654 1,770 971
Shipments (units in thousands) 2,115 1,033 1,082 1,783 332
Vehicle shipments in NAFTA totaled 2,115,000 units for 2012, representing a 19% increase over 2011, on a pro-forma basis. Vehicle shipments were
1,748,000 in the U.S. (up 20% over 2011 on a pro-forma basis), 255,000 in Canada, up 9%, and 98,000 in Mexico, up 22%.
The NAFTA region reported full-year 2012 net revenues of €43.5 billion, up 29% over the prior year on a pro-forma basis (+19% at constant exchange
rates), due to higher volumes and positive pricing, partially offset by an unfavorable mix.
Trading profit for 2012 totaled €2,693 million, up 59% over the prior year on a pro-forma basis (+47% at constant exchange rates), with volume increases
and positive net pricing partially offset by higher advertising expense and higher industrial costs, impacted by additional shifts at certain plants and higher
capacity utilization. EBIT of €2,741 million reflected the strong trading profit performance.
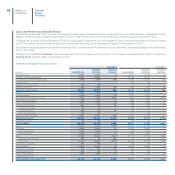
LATAM
(€ million) 2012 2011 Change
2011
pro-forma Change
Net revenues 11,062 10,562 500 11,068 -6
Trading profit 1,063 1,356 -293 1,410 -347
EBIT 1,032 1,331 -299 1,385 -353
Shipments (units in thousands) 979 910 69 929 50
Vehicles shipments in the LATAM region totaled 979,000 units for 2012, representing an increase of 5% over the prior year (on a pro-forma basis) and the
Group’s all-time record for the region. The Brazilian market reacted positively to government stimulus measures introduced in May which remained in place
through the end of 2012. These measures will be gradually phased out during the first half of 2013.
Revenues for the region totaled €11,062 million, substantially in line with the prior year (on a pro-forma basis) with the effect of increased volumes being
offset by negative currency translation impacts. At constant exchange rates, revenues were 5% higher.
Trading profit was €1,063 million, compared with €1,410 million for 2011 (on a pro-forma basis). Higher volumes and increased manufacturing efficiencies
were more than offset by cost inflation (mainly labor, advertising and SG&A), pricing pressure, higher expense related to new vehicle launches and currency
translation impacts. At constant exchange rates, trading profit was €1,105 million. EBIT totaled €1,032 million, including €31 million in unusual charges,
compared to €1,385 million for 2011 (on a pro-forma basis).