Chrysler 2012 Annual Report Download - page 190
Download and view the complete annual report
Please find page 190 of the 2012 Chrysler annual report below. You can navigate through the pages in the report by either clicking on the pages listed below, or by using the keyword search tool below to find specific information within the annual report.-
 1
1 -
2
-
3
-
4
-
5
-
6
-
7
-
8
-
9
-
10
-
11
-
12
-
13
-
14
-
15
-
16
-
17
-
18
-
19
-
20
-
21
-
22
-
23
-
24
-
25
-
26
-
27
-
28
-
29
-
30
-
31
-
32
-
33
-
34
-
35
-
36
-
37
-
38
-
39
-
40
-
41
-
42
-
43
-
44
-
45
-
46
-
47
-
48
-
49
-
50
-
51
-
52
-
53
-
54
-
55
-
56
-
57
-
58
-
59
-
60
-
61
-
62
-
63
-
64
-
65
-
66
-
67
-
68
-
69
-
70
-
71
-
72
-
73
-
74
-
75
-
76
-
77
-
78
-
79
-
80
-
81
-
82
-
83
-
84
-
85
-
86
-
87
-
88
-
89
-
90
-
91
-
92
-
93
-
94
-
95
-
96
-
97
-
98
-
99
-
100
-
101
-
102
-
103
-
104
-
105
-
106
-
107
-
108
-
109
-
110
-
111
-
112
-
113
-
114
-
115
-
116
-
117
-
118
-
119
-
120
-
121
-
122
-
123
-
124
-
125
-
126
-
127
-
128
-
129
-
130
-
131
-
132
-
133
-
134
-
135
-
136
-
137
-
138
-
139
-
140
-
141
-
142
-
143
-
144
-
145
-
146
-
147
-
148
-
149
-
150
-
151
-
152
-
153
-
154
-
155
-
156
-
157
-
158
-
159
-
160
-
161
-
162
-
163
-
164
-
165
-
166
-
167
-
168
-
169
-
170
-
171
-
172
-
173
-
174
-
175
-
176
-
177
-
178
-
179
-
 180
180 -
 181
181 -
 182
182 -
 183
183 -
 184
184 -
 185
185 -
 186
186 -
 187
187 -
 188
188 -
 189
189 -
 190
190 -
 191
191 -
 192
192 -
 193
193 -
 194
194 -
 195
195 -
 196
196 -
 197
197 -
 198
198 -
 199
199 -
 200
200 -
201
-
202
-
203
-
204
-
205
-
206
-
207
-
208
-
209
-
210
-
211
-
212
-
213
-
214
-
215
-
216
-
217
-
218
-
219
-
220
-
221
-
222
-
223
-
224
-
225
-
226
-
227
-
228
-
229
-
230
-
231
-
232
-
233
-
234
-
235
-
236
-
237
-
238
-
239
-
240
-
241
-
242
-
243
-
244
-
245
-
246
-
247
-
248
-
249
-
250
-
251
-
252
-
253
-
254
-
255
-
256
-
257
-
258
-
259
-
260
-
261
-
262
-
263
-
264
-
265
-
266
-
267
-
268
-
269
-
270
-
271
-
272
-
273
-
274
-
275
-
276
-
277
-
278
-
279
-
280
-
281
-
282
-
283
-
284
-
285
-
286
-
287
-
288
-
289
-
290
-
291
-
292
-
293
-
294
-
295
-
296
-
297
-
298
-
299
-
300
-
301
-
302
-
303
-
304
-
305
-
306
-
307
-
308
-
309
-
310
-
311
-
312
-
313
-
314
-
315
-
316
-
317
-
318
-
319
-
320
-
321
-
322
-
323
-
324
-
325
-
326
-
327
-
328
-
329
-
330
-
331
-
332
-
333
-
334
-
335
-
336
-
337
-
338
-
339
-
340
-
341
-
342
-
343
-
344
-
345
-
346
 |
 |

189
Consolidated
Financial Statements
at 31 December 2012
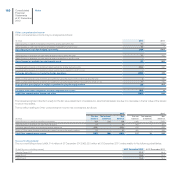
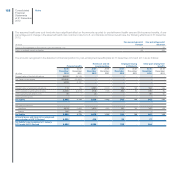
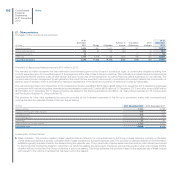
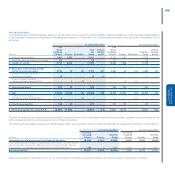
The amounts recognised in the income statement for defined benefit plans in 2012 and in 2011 are as follows:
Pension benefits
Healthcare and life
insurance plans
Employee leaving
entitlements
Other Post-employment
benefits
(€ million) 2012 2011 2012 2011 2012 2011 2012 2011
Current service cost 270 120 23 9--88
Interest costs 1,203 667 103 57 19 21 56
Expected return on plan assets (1,434) (816) ------
Net actuarial losses/(gains) recognised 30 4-(4) --(1) 1
(Negative)/positive past service costs 2-(6) ---(2) (68)
Losses/(gains) on curtailments and settlements 136 ----(1) -
Other (income)/losses ---1---(1)
Total Costs/(gains) 72 11 120 63 19 21 9(54)
Actual return on plan assets 1,887 286 n/a n/a n/a n/a n/a n/a
Estimated impacts from IAS 19 Revised: (*)
Surplus exp. return on plan assets vs int. cost (230) -------
Decrease in EBIT (230) -------
Additional impact from discounting net liability (240) -------
Increase in financial expenses (240) -------
Estimated decrease in net income (470) -------
(*) As if IAS 19R was adopted effective 1 January 2012
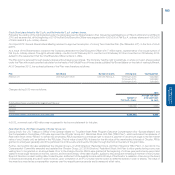
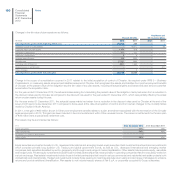
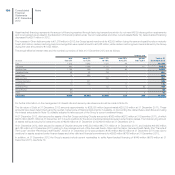
Changes in the present value of Post-employment obligations are as follows:
Pension benefits
Healthcare and life
insurance plans
Employee leaving
entitlements Other
(€ million) 2012 2011 2012 2011 2012 2011 2012 2011
Present value of obligations
at the beginning of the year 25,201 522 2,070 1763 811 156 127
Change in scope of consolidation -20,933 -1,754 4(3) -101
Current service cost 270 120 23 9--88
Interest costs 1,203 667 103 57 19 21 56
Employee contribution 95-5----
Actuarial (gains)/losses 2,477 1,659 282 134 71 710 (1)
Benefits paid (1,796) (990) (145) (82) (62) (73) (13) (18)
Exchange rate differences (402) 2,255 (38) 190 --22
(Negative)/positive past service cost 9-(6) ---(2) (69)
(Gains)/losses on curtailments ------(1) -
(Gains)/losses on settlements 136 -2----
Other changes -(6) ----(1) -
Present value of obligations
at the end of the year 26,972 25,201 2,289 2,070 795 763 164 156