Chrysler 2012 Annual Report Download - page 176
Download and view the complete annual report
Please find page 176 of the 2012 Chrysler annual report below. You can navigate through the pages in the report by either clicking on the pages listed below, or by using the keyword search tool below to find specific information within the annual report.-
 1
1 -
2
-
3
-
4
-
5
-
6
-
7
-
8
-
9
-
10
-
11
-
12
-
13
-
14
-
15
-
16
-
17
-
18
-
19
-
20
-
21
-
22
-
23
-
24
-
25
-
26
-
27
-
28
-
29
-
30
-
31
-
32
-
33
-
34
-
35
-
36
-
37
-
38
-
39
-
40
-
41
-
42
-
43
-
44
-
45
-
46
-
47
-
48
-
49
-
50
-
51
-
52
-
53
-
54
-
55
-
56
-
57
-
58
-
59
-
60
-
61
-
62
-
63
-
64
-
65
-
66
-
67
-
68
-
69
-
70
-
71
-
72
-
73
-
74
-
75
-
76
-
77
-
78
-
79
-
80
-
81
-
82
-
83
-
84
-
85
-
86
-
87
-
88
-
89
-
90
-
91
-
92
-
93
-
94
-
95
-
96
-
97
-
98
-
99
-
100
-
101
-
102
-
103
-
104
-
105
-
106
-
107
-
108
-
109
-
110
-
111
-
112
-
113
-
114
-
115
-
116
-
117
-
118
-
119
-
120
-
121
-
122
-
123
-
124
-
125
-
126
-
127
-
128
-
129
-
130
-
131
-
132
-
133
-
134
-
135
-
136
-
137
-
138
-
139
-
140
-
141
-
142
-
143
-
144
-
145
-
146
-
147
-
148
-
149
-
150
-
151
-
152
-
153
-
154
-
155
-
156
-
157
-
158
-
159
-
160
-
161
-
162
-
163
-
164
-
165
-
 166
166 -
 167
167 -
 168
168 -
 169
169 -
 170
170 -
 171
171 -
 172
172 -
 173
173 -
 174
174 -
 175
175 -
 176
176 -
 177
177 -
 178
178 -
 179
179 -
 180
180 -
 181
181 -
 182
182 -
 183
183 -
 184
184 -
 185
185 -
 186
186 -
187
-
188
-
189
-
190
-
191
-
192
-
193
-
194
-
195
-
196
-
197
-
198
-
199
-
200
-
201
-
202
-
203
-
204
-
205
-
206
-
207
-
208
-
209
-
210
-
211
-
212
-
213
-
214
-
215
-
216
-
217
-
218
-
219
-
220
-
221
-
222
-
223
-
224
-
225
-
226
-
227
-
228
-
229
-
230
-
231
-
232
-
233
-
234
-
235
-
236
-
237
-
238
-
239
-
240
-
241
-
242
-
243
-
244
-
245
-
246
-
247
-
248
-
249
-
250
-
251
-
252
-
253
-
254
-
255
-
256
-
257
-
258
-
259
-
260
-
261
-
262
-
263
-
264
-
265
-
266
-
267
-
268
-
269
-
270
-
271
-
272
-
273
-
274
-
275
-
276
-
277
-
278
-
279
-
280
-
281
-
282
-
283
-
284
-
285
-
286
-
287
-
288
-
289
-
290
-
291
-
292
-
293
-
294
-
295
-
296
-
297
-
298
-
299
-
300
-
301
-
302
-
303
-
304
-
305
-
306
-
307
-
308
-
309
-
310
-
311
-
312
-
313
-
314
-
315
-
316
-
317
-
318
-
319
-
320
-
321
-
322
-
323
-
324
-
325
-
326
-
327
-
328
-
329
-
330
-
331
-
332
-
333
-
334
-
335
-
336
-
337
-
338
-
339
-
340
-
341
-
342
-
343
-
344
-
345
-
346
 |
 |

175
Consolidated
Financial Statements
at 31 December 2012
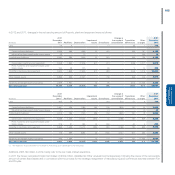
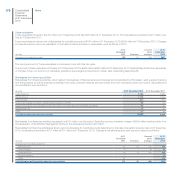
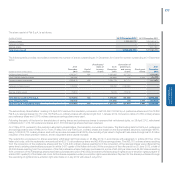
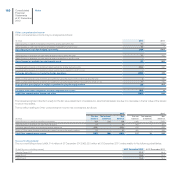
In respect of derivative financial instruments, in 2012 the Group reclassified losses of €105 million (gains of €13 million in 2011), net of the tax effect, from
other comprehensive income to profit or loss. These items are reported in the following lines:
(€ million) 2012 2011
Currency risk
Increase/(Decrease) in Net revenues (92) 65
Decrease/(Increase) in Cost of sales 25 (36)
Financial income/(expenses) 32 (19)
Result from investments (12) 23
Interest rate risk
Decrease/(Increase) in Cost of sales (6) (4)
Result from investments (5) (5)
Financial income/(expenses) (6) (2)
Commodities price risk
Decrease/(Increase) in Cost of sales (40) (3)
Ineffectiveness - overhedges (6) (3)
Taxes income/(expenses) 5(3)
Total recognised in the income statement (105) 13
The ineffectiveness of cash flow hedges was not material in 2012 or 2011.
In 2012 there was an overall negative economic effect of €6 million (negative effect of €3 million in 2011) which subsequently turned out to be in excess of
the future flows being hedged (over-hedges).
Fair value hedges
The gains and losses arising from the valuation of interest rate and currency derivatives financial instruments (mostly for managing currency risk) and interest
rate derivatives (for managing the interest rate risk) recognised in accordance with fair value hedge accounting and the gains and losses arising from the
respective hedged items are set out in the following table:
(€ million) 2012 2011
Currency risk
Net gains/(losses) on qualifying hedges 14 (19)
Fair value changes in hedged items (14) 19
Interest rate risk
Net gains/(losses) on qualifying hedges (51) 24
Fair value changes in hedged items 53 (26)
Net gains/(losses) 2(2)
The ineffective portion of transactions treated as fair value hedges was a positive amount of 2 million in 2012 (negative amount of 2 million in 2011).