Chrysler 2012 Annual Report Download - page 132
Download and view the complete annual report
Please find page 132 of the 2012 Chrysler annual report below. You can navigate through the pages in the report by either clicking on the pages listed below, or by using the keyword search tool below to find specific information within the annual report.-
 1
1 -
2
-
3
-
4
-
5
-
6
-
7
-
8
-
9
-
10
-
11
-
12
-
13
-
14
-
15
-
16
-
17
-
18
-
19
-
20
-
21
-
22
-
23
-
24
-
25
-
26
-
27
-
28
-
29
-
30
-
31
-
32
-
33
-
34
-
35
-
36
-
37
-
38
-
39
-
40
-
41
-
42
-
43
-
44
-
45
-
46
-
47
-
48
-
49
-
50
-
51
-
52
-
53
-
54
-
55
-
56
-
57
-
58
-
59
-
60
-
61
-
62
-
63
-
64
-
65
-
66
-
67
-
68
-
69
-
70
-
71
-
72
-
73
-
74
-
75
-
76
-
77
-
78
-
79
-
80
-
81
-
82
-
83
-
84
-
85
-
86
-
87
-
88
-
89
-
90
-
91
-
92
-
93
-
94
-
95
-
96
-
97
-
98
-
99
-
100
-
101
-
102
-
103
-
104
-
105
-
106
-
107
-
108
-
109
-
110
-
111
-
112
-
113
-
114
-
115
-
116
-
117
-
118
-
119
-
120
-
121
-
 122
122 -
 123
123 -
 124
124 -
 125
125 -
 126
126 -
 127
127 -
 128
128 -
 129
129 -
 130
130 -
 131
131 -
 132
132 -
 133
133 -
 134
134 -
 135
135 -
 136
136 -
 137
137 -
 138
138 -
 139
139 -
 140
140 -
 141
141 -
 142
142 -
143
-
144
-
145
-
146
-
147
-
148
-
149
-
150
-
151
-
152
-
153
-
154
-
155
-
156
-
157
-
158
-
159
-
160
-
161
-
162
-
163
-
164
-
165
-
166
-
167
-
168
-
169
-
170
-
171
-
172
-
173
-
174
-
175
-
176
-
177
-
178
-
179
-
180
-
181
-
182
-
183
-
184
-
185
-
186
-
187
-
188
-
189
-
190
-
191
-
192
-
193
-
194
-
195
-
196
-
197
-
198
-
199
-
200
-
201
-
202
-
203
-
204
-
205
-
206
-
207
-
208
-
209
-
210
-
211
-
212
-
213
-
214
-
215
-
216
-
217
-
218
-
219
-
220
-
221
-
222
-
223
-
224
-
225
-
226
-
227
-
228
-
229
-
230
-
231
-
232
-
233
-
234
-
235
-
236
-
237
-
238
-
239
-
240
-
241
-
242
-
243
-
244
-
245
-
246
-
247
-
248
-
249
-
250
-
251
-
252
-
253
-
254
-
255
-
256
-
257
-
258
-
259
-
260
-
261
-
262
-
263
-
264
-
265
-
266
-
267
-
268
-
269
-
270
-
271
-
272
-
273
-
274
-
275
-
276
-
277
-
278
-
279
-
280
-
281
-
282
-
283
-
284
-
285
-
286
-
287
-
288
-
289
-
290
-
291
-
292
-
293
-
294
-
295
-
296
-
297
-
298
-
299
-
300
-
301
-
302
-
303
-
304
-
305
-
306
-
307
-
308
-
309
-
310
-
311
-
312
-
313
-
314
-
315
-
316
-
317
-
318
-
319
-
320
-
321
-
322
-
323
-
324
-
325
-
326
-
327
-
328
-
329
-
330
-
331
-
332
-
333
-
334
-
335
-
336
-
337
-
338
-
339
-
340
-
341
-
342
-
343
-
344
-
345
-
346
 |
 |

131
Consolidated
Financial Statements
at 31 December 2012
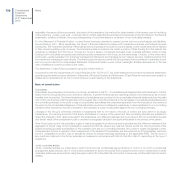
Associates
Associates are enterprises over which the Group has significant influence, as defined in IAS 28 – Investments in Associates, but not
control or joint control over the financial and operating policies. Investments in associates are accounted for using the equity method
from the date that significant influence commences until the date it ceases. When the Group’s share of losses of an associate, if any,
exceeds the carrying amount of the associate in the Group’s balance sheet, the carrying amount is reduced to nil and recognition of
further losses is discontinued except to the extent that the Group has incurred obligations in respect of the associate.
Investments in other companies
Investments in other companies that are available-for-sale financial assets are measured at fair value, when this can be reliably determined.
Gains or losses arising from changes in fair value are recognised directly in other comprehensive income until the assets are sold or are
impaired, when the cumulative gains and losses previously recognised in equity are recognised in the income statement of the period.
Investments in other companies for which fair value is not available are stated at cost less any impairment losses.
Dividends received from Investment in other companies are included in Other income (expenses) from investments.
Transactions eliminated on consolidation
All significant intragroup balances and transactions and any unrealised gains and losses arising from intragroup transactions are
eliminated in preparing the consolidated financial statements. Unrealised gains and losses arising from transactions with associates
and jointly controlled entities are eliminated to the extent of the Group’s interest in those entities.
Foreign currency transactions
The functional currency of the Group’s entities is the currency of their primary economic environment. In individual companies,
transactions in foreign currencies are recorded at the exchange rate prevailing at the date of the transaction. Monetary assets and
liabilities denominated in foreign currencies at the balance sheet date are translated at the exchange rate prevailing at that date.
Exchange differences arising on the settlement of monetary items or on reporting monetary items at rates different from those at which
they were initially recorded during the period or in previous financial statements, are recognised in the income statement.
Consolidation of foreign entities
All assets and liabilities of foreign consolidated companies with a functional currency other than the Euro, the Group’s presentation
currency, are translated using the exchange rates in effect at the balance sheet date. Income and expenses are translated into Euro at
the average exchange rate for the period. Translation differences resulting from the application of this method are classified as equity
until the disposal of the investment. Average rates of exchange are used to translate the cash flows of foreign subsidiaries in preparing
the consolidated statement of cash flows.
The goodwill, assets acquired and liabilities assumed arising from the acquisition of entities with a functional currency other than
the Euro are recognised in the functional currency and translated at the exchange rate at the acquisition date. These balances are
translated at subsequent balance sheet dates at relevant exchange rate.
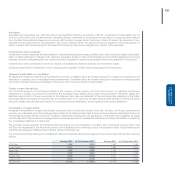
The principal exchange rates used to translate into Euros the financial statements prepared in currencies other than the Euro were as
follows:
Average 2012 At 31 December 2012 Average 2011 At 31 December 2011
U.S. Dollar 1.285 1.319 1.392 1.294
Pound Sterling 0.811 0.816 0.868 0.835
Swiss Franc 1.205 1.207 1.233 1.216
Polish Zloty 4.185 4.074 4.121 4.458
Brazilian Real 2.508 2.704 2.327 2.416
Argentine Peso 5.836 6.478 5.742 5.561
Serbian Dinar 113.120 113.718 101.978 104.858