Chrysler 2012 Annual Report Download - page 136
Download and view the complete annual report
Please find page 136 of the 2012 Chrysler annual report below. You can navigate through the pages in the report by either clicking on the pages listed below, or by using the keyword search tool below to find specific information within the annual report.-
 1
1 -
2
-
3
-
4
-
5
-
6
-
7
-
8
-
9
-
10
-
11
-
12
-
13
-
14
-
15
-
16
-
17
-
18
-
19
-
20
-
21
-
22
-
23
-
24
-
25
-
26
-
27
-
28
-
29
-
30
-
31
-
32
-
33
-
34
-
35
-
36
-
37
-
38
-
39
-
40
-
41
-
42
-
43
-
44
-
45
-
46
-
47
-
48
-
49
-
50
-
51
-
52
-
53
-
54
-
55
-
56
-
57
-
58
-
59
-
60
-
61
-
62
-
63
-
64
-
65
-
66
-
67
-
68
-
69
-
70
-
71
-
72
-
73
-
74
-
75
-
76
-
77
-
78
-
79
-
80
-
81
-
82
-
83
-
84
-
85
-
86
-
87
-
88
-
89
-
90
-
91
-
92
-
93
-
94
-
95
-
96
-
97
-
98
-
99
-
100
-
101
-
102
-
103
-
104
-
105
-
106
-
107
-
108
-
109
-
110
-
111
-
112
-
113
-
114
-
115
-
116
-
117
-
118
-
119
-
120
-
121
-
122
-
123
-
124
-
125
-
 126
126 -
 127
127 -
 128
128 -
 129
129 -
 130
130 -
 131
131 -
 132
132 -
 133
133 -
 134
134 -
 135
135 -
 136
136 -
 137
137 -
 138
138 -
 139
139 -
 140
140 -
 141
141 -
 142
142 -
 143
143 -
 144
144 -
 145
145 -
 146
146 -
147
-
148
-
149
-
150
-
151
-
152
-
153
-
154
-
155
-
156
-
157
-
158
-
159
-
160
-
161
-
162
-
163
-
164
-
165
-
166
-
167
-
168
-
169
-
170
-
171
-
172
-
173
-
174
-
175
-
176
-
177
-
178
-
179
-
180
-
181
-
182
-
183
-
184
-
185
-
186
-
187
-
188
-
189
-
190
-
191
-
192
-
193
-
194
-
195
-
196
-
197
-
198
-
199
-
200
-
201
-
202
-
203
-
204
-
205
-
206
-
207
-
208
-
209
-
210
-
211
-
212
-
213
-
214
-
215
-
216
-
217
-
218
-
219
-
220
-
221
-
222
-
223
-
224
-
225
-
226
-
227
-
228
-
229
-
230
-
231
-
232
-
233
-
234
-
235
-
236
-
237
-
238
-
239
-
240
-
241
-
242
-
243
-
244
-
245
-
246
-
247
-
248
-
249
-
250
-
251
-
252
-
253
-
254
-
255
-
256
-
257
-
258
-
259
-
260
-
261
-
262
-
263
-
264
-
265
-
266
-
267
-
268
-
269
-
270
-
271
-
272
-
273
-
274
-
275
-
276
-
277
-
278
-
279
-
280
-
281
-
282
-
283
-
284
-
285
-
286
-
287
-
288
-
289
-
290
-
291
-
292
-
293
-
294
-
295
-
296
-
297
-
298
-
299
-
300
-
301
-
302
-
303
-
304
-
305
-
306
-
307
-
308
-
309
-
310
-
311
-
312
-
313
-
314
-
315
-
316
-
317
-
318
-
319
-
320
-
321
-
322
-
323
-
324
-
325
-
326
-
327
-
328
-
329
-
330
-
331
-
332
-
333
-
334
-
335
-
336
-
337
-
338
-
339
-
340
-
341
-
342
-
343
-
344
-
345
-
346
 |
 |

135
Consolidated
Financial Statements
at 31 December 2012
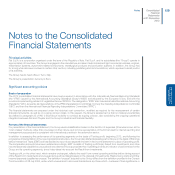
Financial instruments
Presentation
Financial instruments held by the Group are presented in the financial statements as described in the following paragraphs.
Investments and other non-current financial assets comprise investments in unconsolidated companies and other non-current financial
assets (held-to-maturity securities, non-current loans and receivables and other non-current available-for-sale financial assets).
Current financial assets, as defined in IAS 39, include trade receivables, receivables from financing activities (retail financing, dealer
financing, lease financing and other current loans to third parties), current securities and other current financial assets (which include
derivative financial instruments stated at fair value as assets), as well as cash and cash equivalents. In particular, Cash and cash
equivalents include cash at banks, units in liquidity funds and other money market securities that are readily convertible into cash and
are subject to an insignificant risk of changes in value. Current securities include short-term or marketable securities which represent
temporary investments of available funds and do not satisfy the requirements for being classified as cash equivalents; current securities
include both available-for-sale and held-for-trading securities.
Financial liabilities refer to debt, which includes asset-backed financing, and other financial liabilities (which include derivative financial
instruments stated at fair value as liabilities), trade payables and other payables.
Measurement
Investments in unconsolidated companies classified as non-current financial assets are accounted for as described in the paragraph
– Investments in other companies.
Non-current financial assets other than investments, as well as current financial assets and financial liabilities, are accounted for in
accordance with IAS 39 – Financial Instruments: Recognition and Measurement.
Current financial assets and held-to-maturity securities are recognised on the basis of the settlement date and, on initial recognition,
are measured at acquisition cost, including transaction costs.
Subsequent to initial recognition, available-for-sale and held-for-trading financial assets are measured at fair value. When market prices
are not available, the fair value of available-for-sale financial assets is measured using appropriate valuation techniques (e.g. discounted
cash flow analysis based on market information available at the balance sheet date).
Gains and losses on available-for-sale financial assets are recognised directly in other comprehensive income until the financial asset is
disposed of or is determined to be impaired; when the asset is disposed of, the cumulative gains or losses, including those previously
recognised in other comprehensive income, are reclassified to the income statement for the period; when the asset is impaired,
accumulated losses are recognised in the income statement. Gains and losses arising from changes in the fair value of held-for-trading
financial instruments are included in the income statement for the period.
Loans and receivables which are not held by the Group for trading (loans and receivables originating in the course of business), held-to-
maturity securities and all financial assets for which published price quotations in an active market are not available and whose fair value
cannot be determined reliably, are measured, to the extent that they have a fixed term, at amortised cost, using the effective interest
method. When the financial assets do not have a fixed term, they are measured at acquisition cost. Receivables with maturities of over
one year which bear no interest or an interest rate significantly lower than market rates are discounted using market rates.
Assessments are made regularly as to whether there is any objective evidence that a financial asset or group of assets may be impaired.
If any such evidence exists, an impairment loss is included in the income statement for the period.
Except for derivative instruments, financial liabilities are measured at amortised cost using the effective interest method.
Financial assets and liabilities hedged against changes in fair value (fair value hedge) are measured in accordance with hedge accounting
principles: gains and losses arising from remeasurement at fair value, due to changes in the respective hedged risk, are recognised in
the income statement and are offset by the effective portion of the loss or gain arising from remeasurement at fair value of the hedging
instrument.