Chrysler 2012 Annual Report Download - page 200
Download and view the complete annual report
Please find page 200 of the 2012 Chrysler annual report below. You can navigate through the pages in the report by either clicking on the pages listed below, or by using the keyword search tool below to find specific information within the annual report.-
 1
1 -
2
-
3
-
4
-
5
-
6
-
7
-
8
-
9
-
10
-
11
-
12
-
13
-
14
-
15
-
16
-
17
-
18
-
19
-
20
-
21
-
22
-
23
-
24
-
25
-
26
-
27
-
28
-
29
-
30
-
31
-
32
-
33
-
34
-
35
-
36
-
37
-
38
-
39
-
40
-
41
-
42
-
43
-
44
-
45
-
46
-
47
-
48
-
49
-
50
-
51
-
52
-
53
-
54
-
55
-
56
-
57
-
58
-
59
-
60
-
61
-
62
-
63
-
64
-
65
-
66
-
67
-
68
-
69
-
70
-
71
-
72
-
73
-
74
-
75
-
76
-
77
-
78
-
79
-
80
-
81
-
82
-
83
-
84
-
85
-
86
-
87
-
88
-
89
-
90
-
91
-
92
-
93
-
94
-
95
-
96
-
97
-
98
-
99
-
100
-
101
-
102
-
103
-
104
-
105
-
106
-
107
-
108
-
109
-
110
-
111
-
112
-
113
-
114
-
115
-
116
-
117
-
118
-
119
-
120
-
121
-
122
-
123
-
124
-
125
-
126
-
127
-
128
-
129
-
130
-
131
-
132
-
133
-
134
-
135
-
136
-
137
-
138
-
139
-
140
-
141
-
142
-
143
-
144
-
145
-
146
-
147
-
148
-
149
-
150
-
151
-
152
-
153
-
154
-
155
-
156
-
157
-
158
-
159
-
160
-
161
-
162
-
163
-
164
-
165
-
166
-
167
-
168
-
169
-
170
-
171
-
172
-
173
-
174
-
175
-
176
-
177
-
178
-
179
-
180
-
181
-
182
-
183
-
184
-
185
-
186
-
187
-
188
-
189
-
 190
190 -
 191
191 -
 192
192 -
 193
193 -
 194
194 -
 195
195 -
 196
196 -
 197
197 -
 198
198 -
 199
199 -
 200
200 -
 201
201 -
 202
202 -
 203
203 -
 204
204 -
 205
205 -
 206
206 -
 207
207 -
 208
208 -
 209
209 -
 210
210 -
211
-
212
-
213
-
214
-
215
-
216
-
217
-
218
-
219
-
220
-
221
-
222
-
223
-
224
-
225
-
226
-
227
-
228
-
229
-
230
-
231
-
232
-
233
-
234
-
235
-
236
-
237
-
238
-
239
-
240
-
241
-
242
-
243
-
244
-
245
-
246
-
247
-
248
-
249
-
250
-
251
-
252
-
253
-
254
-
255
-
256
-
257
-
258
-
259
-
260
-
261
-
262
-
263
-
264
-
265
-
266
-
267
-
268
-
269
-
270
-
271
-
272
-
273
-
274
-
275
-
276
-
277
-
278
-
279
-
280
-
281
-
282
-
283
-
284
-
285
-
286
-
287
-
288
-
289
-
290
-
291
-
292
-
293
-
294
-
295
-
296
-
297
-
298
-
299
-
300
-
301
-
302
-
303
-
304
-
305
-
306
-
307
-
308
-
309
-
310
-
311
-
312
-
313
-
314
-
315
-
316
-
317
-
318
-
319
-
320
-
321
-
322
-
323
-
324
-
325
-
326
-
327
-
328
-
329
-
330
-
331
-
332
-
333
-
334
-
335
-
336
-
337
-
338
-
339
-
340
-
341
-
342
-
343
-
344
-
345
-
346
 |
 |

199
Consolidated
Financial Statements
at 31 December 2012
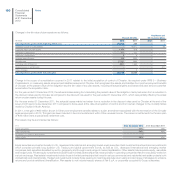
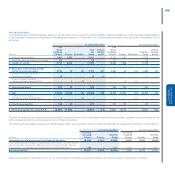
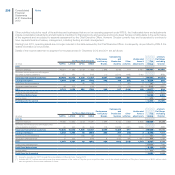
Net financial position
In compliance with Consob Regulation issued on 28 July 2006 and in conformity with the CESR’s “Recommendations for the consistent implementation
of the European Commission’s Regulation on Prospectuses” issued on 10 February 2005, the Net financial position of the Group at 31 December 2012 is
as follows:
At 31 December 2012 At 31 December 2011
(€ million)
Fiat
Group
excluding
Chrysler Chrysler Elimination
Total
Fiat
Group
of which
Related
parties
Fiat
Group
excluding
Chrysler Chrysler Elimination
Total Fiat
Group
of which
Related
parties
A. Cash and cash equivalents 8,854 8,803 - 17,657 - 10,106 7,420 - 17,526 -
B. Current securities (securities held for trading) 256 - - 256 - 199 - - 199 -
C. Liquidity (C) = (A+B) 9,110 8,803 - 17,913 - 10,305 7,420 - 17,725 -
D. Receivables from financing activities
(Current financial receivables) 3,724 12 (9) 3,727 201 3,958 20 (10) 3,968 197
of which: From jointly-controlled
financial services entities 58 - - 58 58 21 - - 21 21
of which: financial receivables
for intragroup leased assets (IFRIC 4) - 9 (9) - - - 10 (10) - -
E. Other financial assets 474 45 - 519 - 430 127 - 557 -
F. Debt 17,586 10,312 (9) 27,889 272 16,245 10,537 (10) 26,772 331
of which: financial payables
for intragroup leased assets (IFRIC 4) 9 - (9) - - 10 - (10) - -
G. Other financial liabilities 159 42 - 201 - 329 100 - 429 -
H. Net financial position (H) = (C+D+E-F-G) (4,437) (1,494) - (5,931) (71) (1,881) (3,070) - (4,951) (134)
The item Receivables from financing activities includes the entire portfolio of the consolidated financial services entities, classified as current assets as they
will be realised during the normal operating cycle of these companies.
The following is reconciliation between the Net financial position as presented in the above table and Net debt as presented in the Report on Operations:
At 31 December 2012 At 31 December 2011
(€ million)
Fiat Group
excluding
Chrysler Chrysler
Total Fiat
Group
Fiat Group
excluding
Chrysler Chrysler
Total Fiat
Group
Consolidated net debt as presented in the Report on Operations (8,103) (1,497) (9,600) (5,818) (3,080) (8,898)
Less: Current financial receivables, excluding those due from jointly controlled financial
services companies, amounting to €58 million at 31 December 2012 (€21 million at
31 December 2011), and financial receivables for leased assets under IFRIC 4 3,666 3 3,669 3,937 10 3,947
Net financial position (4,437) (1,494) (5,931) (1,881) (3,070) (4,951)
Reference should be made to Notes 19, 20, 21 and 22 and the information provided in this Note for a further analysis of the items in the table.