Reebok 2010 Annual Report Download - page 39
Download and view the complete annual report
Please find page 39 of the 2010 Reebok annual report below. You can navigate through the pages in the report by either clicking on the pages listed below, or by using the keyword search tool below to find specific information within the annual report.-
 1
1 -
2
-
3
-
4
-
5
-
6
-
7
-
8
-
9
-
10
-
11
-
12
-
13
-
14
-
15
-
16
-
17
-
18
-
19
-
20
-
21
-
22
-
23
-
24
-
25
-
26
-
27
-
28
-
 29
29 -
 30
30 -
 31
31 -
 32
32 -
 33
33 -
 34
34 -
 35
35 -
 36
36 -
 37
37 -
 38
38 -
 39
39 -
 40
40 -
 41
41 -
 42
42 -
 43
43 -
 44
44 -
 45
45 -
 46
46 -
 47
47 -
 48
48 -
 49
49 -
50
-
51
-
52
-
53
-
54
-
55
-
56
-
57
-
58
-
59
-
60
-
61
-
62
-
63
-
64
-
65
-
66
-
67
-
68
-
69
-
70
-
71
-
72
-
73
-
74
-
75
-
76
-
77
-
78
-
79
-
80
-
81
-
82
-
83
-
84
-
85
-
86
-
87
-
88
-
89
-
90
-
91
-
92
-
93
-
94
-
95
-
96
-
97
-
98
-
99
-
100
-
101
-
102
-
103
-
104
-
105
-
106
-
107
-
108
-
109
-
110
-
111
-
112
-
113
-
114
-
115
-
116
-
117
-
118
-
119
-
120
-
121
-
122
-
123
-
124
-
125
-
126
-
127
-
128
-
129
-
130
-
131
-
132
-
133
-
134
-
135
-
136
-
137
-
138
-
139
-
140
-
141
-
142
-
143
-
144
-
145
-
146
-
147
-
148
-
149
-
150
-
151
-
152
-
153
-
154
-
155
-
156
-
157
-
158
-
159
-
160
-
161
-
162
-
163
-
164
-
165
-
166
-
167
-
168
-
169
-
170
-
171
-
172
-
173
-
174
-
175
-
176
-
177
-
178
-
179
-
180
-
181
-
182
-
183
-
184
-
185
-
186
-
187
-
188
-
189
-
190
-
191
-
192
-
193
-
194
-
195
-
196
-
197
-
198
-
199
-
200
-
201
-
202
-
203
-
204
-
205
-
206
-
207
-
208
-
209
-
210
-
211
-
212
-
213
-
214
-
215
-
216
-
217
-
218
-
219
-
220
-
221
-
222
-
223
-
224
-
225
-
226
-
227
-
228
-
229
-
230
-
231
-
232
-
233
-
234
-
235
-
236
-
237
-
238
-
239
-
240
-
241
-
242
-
243
-
244
-
245
-
246
-
247
-
248
 |
 |
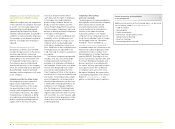
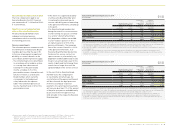
To Our Shareholders Our Share 35
adidas AG market capitalisation at year-end
€ in millions
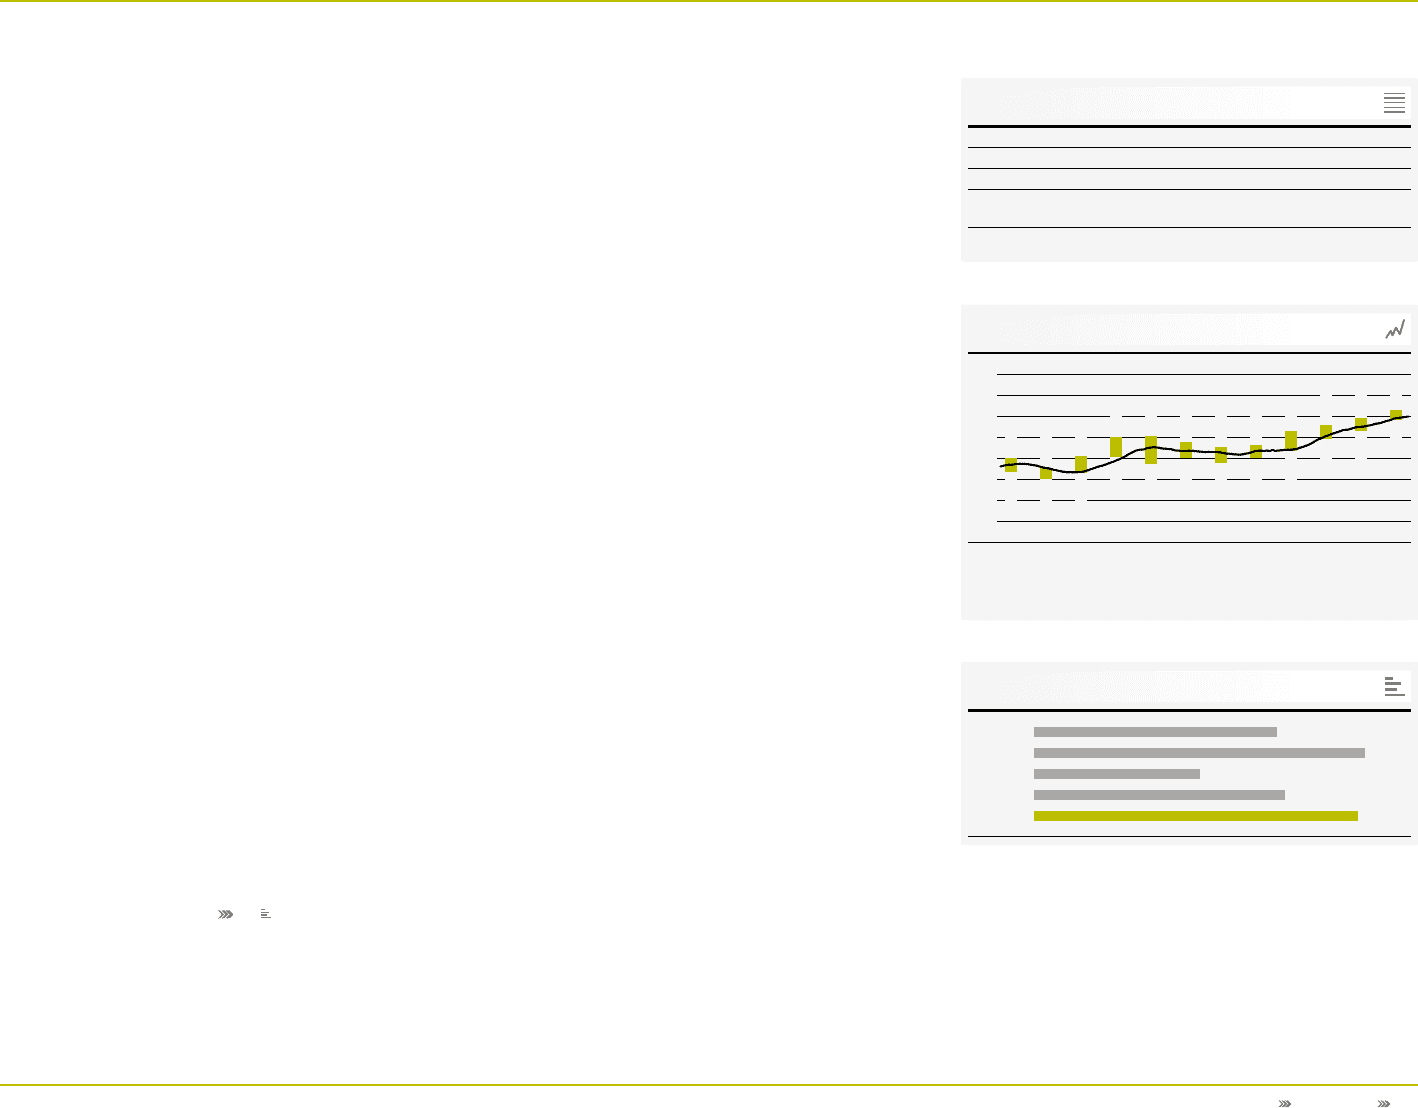
adidas AG high and low share prices per month 1 )
in €
Jan. 2010 Dec. 2010
50
40
30
—
30-day moving average
|
High and low share prices
1) Based on daily closing prices.
Source: Bloomberg.
04
03
2006
2007
2008
2009
2010
7,679
10,438
5,252
7,902
10,229
The preliminary announcement of better
than expected first quarter results at
the end of April helped our share price
to resist the general market depression
throughout the second quarter and to
gain slightly. Positive feedback from a
Reebok investor event in London as well
as our increased sales outlook for the
football category published in mid-May
also contributed to this development.
Following the preliminary announce-
ment of better than expected first half
year results in July, the adidas AG share
price gained markedly towards the end
of the month. The favourable momentum
was sustained after the final results
release in August, and an increased full
year outlook helped the adidas AG share
outperform international indices during
the third quarter.
In the fourth quarter, strong third
quarter results as well as the sales and
earnings per share outlook for 2011
published at the beginning of November,
while well received by most investors and
analysts, did not provide further stimulus
to the share price. However, following
the announcement of the adidas Group’s
strategic business plan “Route 2015”
on November 8, market participants
expressed their confidence in our Group’s
medium- to long-term strategic goals.
This was reflected in further share price
gains during the last weeks of the year.
As a result, the adidas AG share closed
2010 at € 48.89, representing a 29%
increase over the course of the year.
This implies a market capitalisation of
€ 10.2 billion at the end of 2010 versus
€ 7.9 billion at the end of 2009 see 04.
adidas AG share member of adidas AG share member of
important indicesimportant indices
The adidas AG share is included in a
variety of high-quality indices around
the world, most importantly the DAX-30
and the MSCI World Textiles, Apparel &
Luxury Goods Index.
The DAX-30 is a blue chip stock
market index consisting of the 30 major
German companies trading on the
Frankfurt Stock Exchange.
The MSCI World Textiles, Apparel
& Luxury Goods Index comprises our
Group’s major competitors. At December
31, 2010, our weighting in the DAX-30,
which is calculated on the basis of free
float market capitalisation and 12-month
share turnover, was 1.69% (2009: 1.49%).
Our increased weighting compared to
the prior year was mainly a result of our
higher market capitalisation, which more
than offset a more pronounced decline
in share turnover compared to the rest
of the market. Average daily trading
volume of the adidas AG share on all
German stock exchanges (excluding bank
trades) declined from 1.4 million in 2009
to 1.2 million shares in 2010. Within the
DAX-30, we ranked 16 on market capi-
talisation (2009: 17) and 23 on turnover
(2009: 22) at year-end 2010. However,
the average daily trading volume of the
adidas AG share on alternative trading
systems increased more than 40% to
0.7 million shares versus 0.5 million
shares in 2009.
Conversion from bearer to Conversion from bearer to
registered sharesregistered shares
Following the approval of resolution 13
at our Annual General Meeting on May 6,
2010, the no-par-value bearer shares
of adidas AG were converted to regis-
tered no-par-value shares (registered
shares) on October 11, 2010. Since this
date, adidas AG registered shares are
traded on the stock exchange under a
new ISIN DE000A1EWWW0 (previously:
DE0005003404) or WKN A1EWWW (pre-
viously: 500340). The stock symbol ADS
remains unchanged. The legal position of
the shareholders who are entered in the
share register as well as their holding in
adidas AG has not been affected by the
conversion to registered shares. Further,
shareholders’ rights to sell their shares
or purchase shares are not limited or
made more complicated.
Historical performance of adidas AG share and
important indices at year-end 2010 1) in %
1 year 3 years 5 years 10 years since IPO
adidas AG 29 (5) 22 196 406
DAX-30 16 (14) 28 7 215
MSCI World Textiles,
Apparel & Luxury Goods 44 28 71 154 243
1) Source: Bloomberg.
02
39.85
37.46
40,53
44.85
45.25
43.68
42.55
43.16
46.35
47.76
49.45
51.48
36.29
35.00
36.47
40.14
38.59
39.85
38.67
39.86
41.56
44.58
46.30
48.89