Reebok 2010 Annual Report Download - page 135
Download and view the complete annual report
Please find page 135 of the 2010 Reebok annual report below. You can navigate through the pages in the report by either clicking on the pages listed below, or by using the keyword search tool below to find specific information within the annual report.-
 1
1 -
2
-
3
-
4
-
5
-
6
-
7
-
8
-
9
-
10
-
11
-
12
-
13
-
14
-
15
-
16
-
17
-
18
-
19
-
20
-
21
-
22
-
23
-
24
-
25
-
26
-
27
-
28
-
29
-
30
-
31
-
32
-
33
-
34
-
35
-
36
-
37
-
38
-
39
-
40
-
41
-
42
-
43
-
44
-
45
-
46
-
47
-
48
-
49
-
50
-
51
-
52
-
53
-
54
-
55
-
56
-
57
-
58
-
59
-
60
-
61
-
62
-
63
-
64
-
65
-
66
-
67
-
68
-
69
-
70
-
71
-
72
-
73
-
74
-
75
-
76
-
77
-
78
-
79
-
80
-
81
-
82
-
83
-
84
-
85
-
86
-
87
-
88
-
89
-
90
-
91
-
92
-
93
-
94
-
95
-
96
-
97
-
98
-
99
-
100
-
101
-
102
-
103
-
104
-
105
-
106
-
107
-
108
-
109
-
110
-
111
-
112
-
113
-
114
-
115
-
116
-
117
-
118
-
119
-
120
-
121
-
122
-
123
-
124
-
 125
125 -
 126
126 -
 127
127 -
 128
128 -
 129
129 -
 130
130 -
 131
131 -
 132
132 -
 133
133 -
 134
134 -
 135
135 -
 136
136 -
 137
137 -
 138
138 -
 139
139 -
 140
140 -
 141
141 -
 142
142 -
 143
143 -
 144
144 -
 145
145 -
146
-
147
-
148
-
149
-
150
-
151
-
152
-
153
-
154
-
155
-
156
-
157
-
158
-
159
-
160
-
161
-
162
-
163
-
164
-
165
-
166
-
167
-
168
-
169
-
170
-
171
-
172
-
173
-
174
-
175
-
176
-
177
-
178
-
179
-
180
-
181
-
182
-
183
-
184
-
185
-
186
-
187
-
188
-
189
-
190
-
191
-
192
-
193
-
194
-
195
-
196
-
197
-
198
-
199
-
200
-
201
-
202
-
203
-
204
-
205
-
206
-
207
-
208
-
209
-
210
-
211
-
212
-
213
-
214
-
215
-
216
-
217
-
218
-
219
-
220
-
221
-
222
-
223
-
224
-
225
-
226
-
227
-
228
-
229
-
230
-
231
-
232
-
233
-
234
-
235
-
236
-
237
-
238
-
239
-
240
-
241
-
242
-
243
-
244
-
245
-
246
-
247
-
248
 |
 |

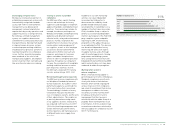
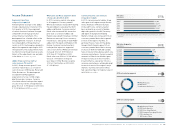
Group Management Report – Financial Review Group Business Performance Economic and Sector Development 131
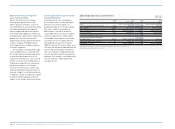
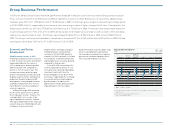
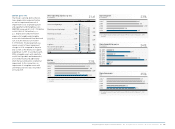
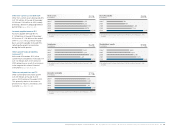
Quarterly unemployment rate by region
in % of total active population
Q4 2009 Q1 2010 Q2 2010 Q3 2010 Q4 2010
USA 1 ) 10.0 9.7 9.6 9.6 9.6
Euro Zone 2 ) 9.9 9.9 10.0 10.0 10.0
Japan 3 ) 5.2 5.0 5.3 5.0 4.9
China 4 ) 4.3 4.2 4.2 4.1 4.1
Russia 5 ) 8.2 8.6 6.8 6.6 7.2
1) Source: US Bureau of Labor Statistics.
2) Source: Eurostat.
3) Source: Japan Ministry of Internal Affairs and Communications.
4) Source: China National Bureau of Statistics.
5) Source: Russia Federal Service of State Statistics.
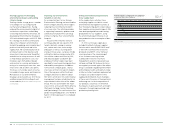
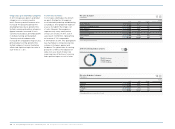
Quarterly consumer confidence development
by region
Q4 2009 Q1 2010 Q2 2010 Q3 2010 Q4 2010
USA 1 ) 53.6 52.3 54.3 48.6 53.3
Euro Zone 2 ) (16) (17) (17) (11) (11)
Japan 3 ) 37.9 41.0 43.6 41.4 40.2
China 4 ) 103.9 107.9 108.5 104.1 102.9
Russia 5 ) (20) (10) (7) (11) (10)
1) Source: Conference Board.
2) Source: European Commission.
3) Source: Economic and Social Research Institute, Government of Japan.
4) Source: China National Bureau of Statistics.
5) Source: Russia Federal Service of State Statistics.
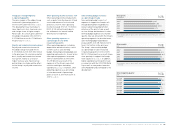
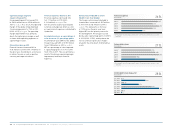
Quarterly development of Consumer Price Index 1) 2)
by region
Q4 2009 Q1 2010 Q2 2010 Q3 2010 Q4 2010
USA 2.7 2.3 1.1 1.1 1.5
Euro Zone 0.9 1.4 1.4 1.8 2.2
Japan (1.7) (1.1) (0.7) (0.6) 0.0
China 1.9 2.4 2.9 3.6 4.6
Russia 8.8 6.5 5.8 7.0 8.8
1) Source: Bloomberg.
2) Quarter-end figures.
02
04
03
In 2010, Asian economies continued to
lead the global economic recovery, with
GDP increasing 6.7% (2009: 0.3%), driven
by industrial production and resilience
in domestic demand and retail sales.
China’s GDP grew by 10.0% in 2010
(2009: 9.1%), mainly due to growth in
industrial production and export volumes.
This economic development supported
further wage growth and saw consumer
spending rise by 9.5%. Most other
economies in the region also posted
similar trends, including India where GDP
growth is projected at 9.2%.
Japan’s GDP gain, however, was
lower than the regional average at
4.3% (2009: decline of 6.3%). Economic
recovery in Japan was driven by export
demand from other Asian economies.
However, the appreciation of the yen put
pressure on international trade levels and
together with a sluggish labour market
led to weakening GDP trends towards the
end of the year.
In Latin America, full year GDP
increased 6.6% (2009: decline of
3.4%). The strong recovery was mainly
attributable to rising commodity
prices and strong domestic demand.
Furthermore, the rise in employment
rates and income levels stimulated
consumer spending in the region.
Positive growth in the global
sporting goods industry
In 2010, the sporting goods industry
benefited from the broad-based
improvement in consumer confidence
and spending levels in most regions and
markets around the world. The 2010
FIFA World Cup contributed strongly
to the positive trends, particularly in
Western Europe and Latin America.
The turnaround of the inventory cycle
in the first half of 2010 supported the
sector in many major markets. A robust
back-to-school period in North America
and Europe maintained the positive
momentum in the second half. Increasing
consumer spending levels gave further
impetus to the expansion of the sporting
goods industry in the emerging markets,
particularly in Asia and Latin America.
Lower input costs as well as less
clearance activity positively impacted the
industry’s profitability.
FIFA World Cup adds momentum to
Europe’s sporting goods industry
In 2010, the European sporting goods
industry grew modestly. The region
benefited sustainably from the 2010
FIFA World Cup, with three out of
the last four teams coming from
the region. Nevertheless, there was
significant country variation with high
unemployment levels depressing
consumer spending in general,
particularly in the region’s peripheral
countries. Sales in both footwear and
apparel increased in Europe, with
footwear rebounding faster than apparel.
The latter, however, benefited later in the
year due to cold weather conditions.