Reebok 2010 Annual Report Download - page 145
Download and view the complete annual report
Please find page 145 of the 2010 Reebok annual report below. You can navigate through the pages in the report by either clicking on the pages listed below, or by using the keyword search tool below to find specific information within the annual report.-
 1
1 -
2
-
3
-
4
-
5
-
6
-
7
-
8
-
9
-
10
-
11
-
12
-
13
-
14
-
15
-
16
-
17
-
18
-
19
-
20
-
21
-
22
-
23
-
24
-
25
-
26
-
27
-
28
-
29
-
30
-
31
-
32
-
33
-
34
-
35
-
36
-
37
-
38
-
39
-
40
-
41
-
42
-
43
-
44
-
45
-
46
-
47
-
48
-
49
-
50
-
51
-
52
-
53
-
54
-
55
-
56
-
57
-
58
-
59
-
60
-
61
-
62
-
63
-
64
-
65
-
66
-
67
-
68
-
69
-
70
-
71
-
72
-
73
-
74
-
75
-
76
-
77
-
78
-
79
-
80
-
81
-
82
-
83
-
84
-
85
-
86
-
87
-
88
-
89
-
90
-
91
-
92
-
93
-
94
-
95
-
96
-
97
-
98
-
99
-
100
-
101
-
102
-
103
-
104
-
105
-
106
-
107
-
108
-
109
-
110
-
111
-
112
-
113
-
114
-
115
-
116
-
117
-
118
-
119
-
120
-
121
-
122
-
123
-
124
-
125
-
126
-
127
-
128
-
129
-
130
-
131
-
132
-
133
-
134
-
 135
135 -
 136
136 -
 137
137 -
 138
138 -
 139
139 -
 140
140 -
 141
141 -
 142
142 -
 143
143 -
 144
144 -
 145
145 -
 146
146 -
 147
147 -
 148
148 -
 149
149 -
 150
150 -
 151
151 -
 152
152 -
 153
153 -
 154
154 -
 155
155 -
156
-
157
-
158
-
159
-
160
-
161
-
162
-
163
-
164
-
165
-
166
-
167
-
168
-
169
-
170
-
171
-
172
-
173
-
174
-
175
-
176
-
177
-
178
-
179
-
180
-
181
-
182
-
183
-
184
-
185
-
186
-
187
-
188
-
189
-
190
-
191
-
192
-
193
-
194
-
195
-
196
-
197
-
198
-
199
-
200
-
201
-
202
-
203
-
204
-
205
-
206
-
207
-
208
-
209
-
210
-
211
-
212
-
213
-
214
-
215
-
216
-
217
-
218
-
219
-
220
-
221
-
222
-
223
-
224
-
225
-
226
-
227
-
228
-
229
-
230
-
231
-
232
-
233
-
234
-
235
-
236
-
237
-
238
-
239
-
240
-
241
-
242
-
243
-
244
-
245
-
246
-
247
-
248
 |
 |
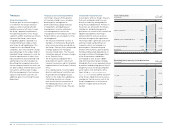
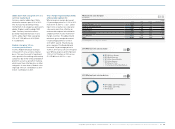
Group Management Report – Financial Review Group Business Performance Statement of Financial Position and Statement of Cash Flows 141
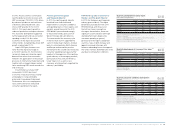
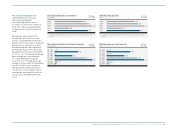
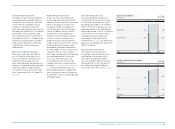
Accounts payable
€ in millions
1) Including Reebok, Rockport and Reebok-CCM Hockey from February 1, 2006
onwards.
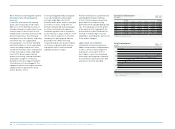
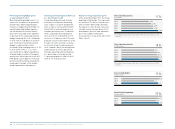
Shareholders’ equity
€ in millions
1) Including Reebok, Rockport and Reebok-CCM Hockey from February 1, 2006
onwards.
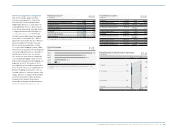
Total assets
€ in millions
1) Including Reebok, Rockport and Reebok-CCM Hockey from February 1, 2006
onwards.
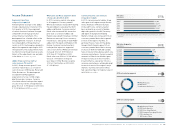
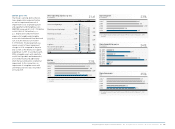
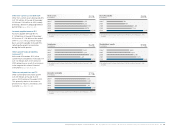
Inventories
€ in millions
1) Including Reebok, Rockport and Reebok-CCM Hockey from February 1, 2006
onwards.
Accounts receivable
€ in millions
1) Including Reebok, Rockport and Reebok-CCM Hockey from February 1, 2006
onwards.
38
39
35
36
37
2006 1 )
2007
2008
2009
2010
2006 1 )
2007
2008
2009
2010
2006 1 )
2007
2008
2009
2010
2006 1 )
2007
2008
2009
2010
2006 1 )
2007
2008
2009
2010
752
849
1,218
1,166
1,694
2,828
3,023
3,386
3,771
4,616
8,379
8,325
9,533
8,875
10,618
1,607
1,629
1,995
1,471
2,119
1,415
1,459
1,624
1,429
1,667
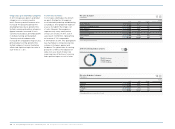
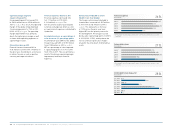
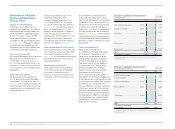
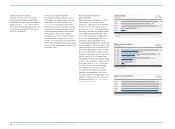
Other non-current assets down 20%
Other non-current assets decreased 20%
to € 100 million at the end of December
2010 from € 126 million in 2009, mainly
driven by a decline in prepaid promotion
partnerships see Note 16, p. 200.
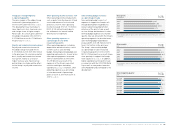
Accounts payable increase 45%
Accounts payable were up 45% to
€ 1.694 billion at the end of December
2010 versus € 1.166 billion at the end of
2009 see 38. On a currency-neutral
basis, accounts payable increased 36%,
reflecting the growth in inventories
during the fourth quarter.
Other current financial liabilities
increase 21%
At the end of December 2010, other
current financial liabilities increased 21%
to € 123 million from € 101 million in
2009, primarily as a result of an increase
in the negative fair value of financial
instruments see Note 18, p. 200.
Other current provisions up 47%
Other current provisions were up 47%
to € 470 million at the end of 2010
versus € 320 million at the end of 2009.
This primarily relates to increases in
provisions for returns, allowances and
warranty see Note 19, p. 201.