Reebok 2010 Annual Report Download - page 146
Download and view the complete annual report
Please find page 146 of the 2010 Reebok annual report below. You can navigate through the pages in the report by either clicking on the pages listed below, or by using the keyword search tool below to find specific information within the annual report.-
 1
1 -
2
-
3
-
4
-
5
-
6
-
7
-
8
-
9
-
10
-
11
-
12
-
13
-
14
-
15
-
16
-
17
-
18
-
19
-
20
-
21
-
22
-
23
-
24
-
25
-
26
-
27
-
28
-
29
-
30
-
31
-
32
-
33
-
34
-
35
-
36
-
37
-
38
-
39
-
40
-
41
-
42
-
43
-
44
-
45
-
46
-
47
-
48
-
49
-
50
-
51
-
52
-
53
-
54
-
55
-
56
-
57
-
58
-
59
-
60
-
61
-
62
-
63
-
64
-
65
-
66
-
67
-
68
-
69
-
70
-
71
-
72
-
73
-
74
-
75
-
76
-
77
-
78
-
79
-
80
-
81
-
82
-
83
-
84
-
85
-
86
-
87
-
88
-
89
-
90
-
91
-
92
-
93
-
94
-
95
-
96
-
97
-
98
-
99
-
100
-
101
-
102
-
103
-
104
-
105
-
106
-
107
-
108
-
109
-
110
-
111
-
112
-
113
-
114
-
115
-
116
-
117
-
118
-
119
-
120
-
121
-
122
-
123
-
124
-
125
-
126
-
127
-
128
-
129
-
130
-
131
-
132
-
133
-
134
-
135
-
 136
136 -
 137
137 -
 138
138 -
 139
139 -
 140
140 -
 141
141 -
 142
142 -
 143
143 -
 144
144 -
 145
145 -
 146
146 -
 147
147 -
 148
148 -
 149
149 -
 150
150 -
 151
151 -
 152
152 -
 153
153 -
 154
154 -
 155
155 -
 156
156 -
157
-
158
-
159
-
160
-
161
-
162
-
163
-
164
-
165
-
166
-
167
-
168
-
169
-
170
-
171
-
172
-
173
-
174
-
175
-
176
-
177
-
178
-
179
-
180
-
181
-
182
-
183
-
184
-
185
-
186
-
187
-
188
-
189
-
190
-
191
-
192
-
193
-
194
-
195
-
196
-
197
-
198
-
199
-
200
-
201
-
202
-
203
-
204
-
205
-
206
-
207
-
208
-
209
-
210
-
211
-
212
-
213
-
214
-
215
-
216
-
217
-
218
-
219
-
220
-
221
-
222
-
223
-
224
-
225
-
226
-
227
-
228
-
229
-
230
-
231
-
232
-
233
-
234
-
235
-
236
-
237
-
238
-
239
-
240
-
241
-
242
-
243
-
244
-
245
-
246
-
247
-
248
 |
 |
142 Group Management Report – Financial Review Group Business Performance Statement of Financial Position and Statement of Cash Flows
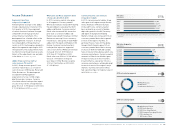
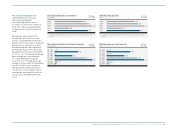
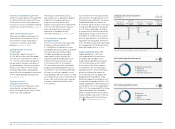
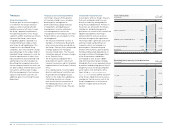
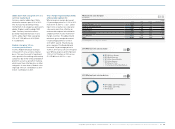
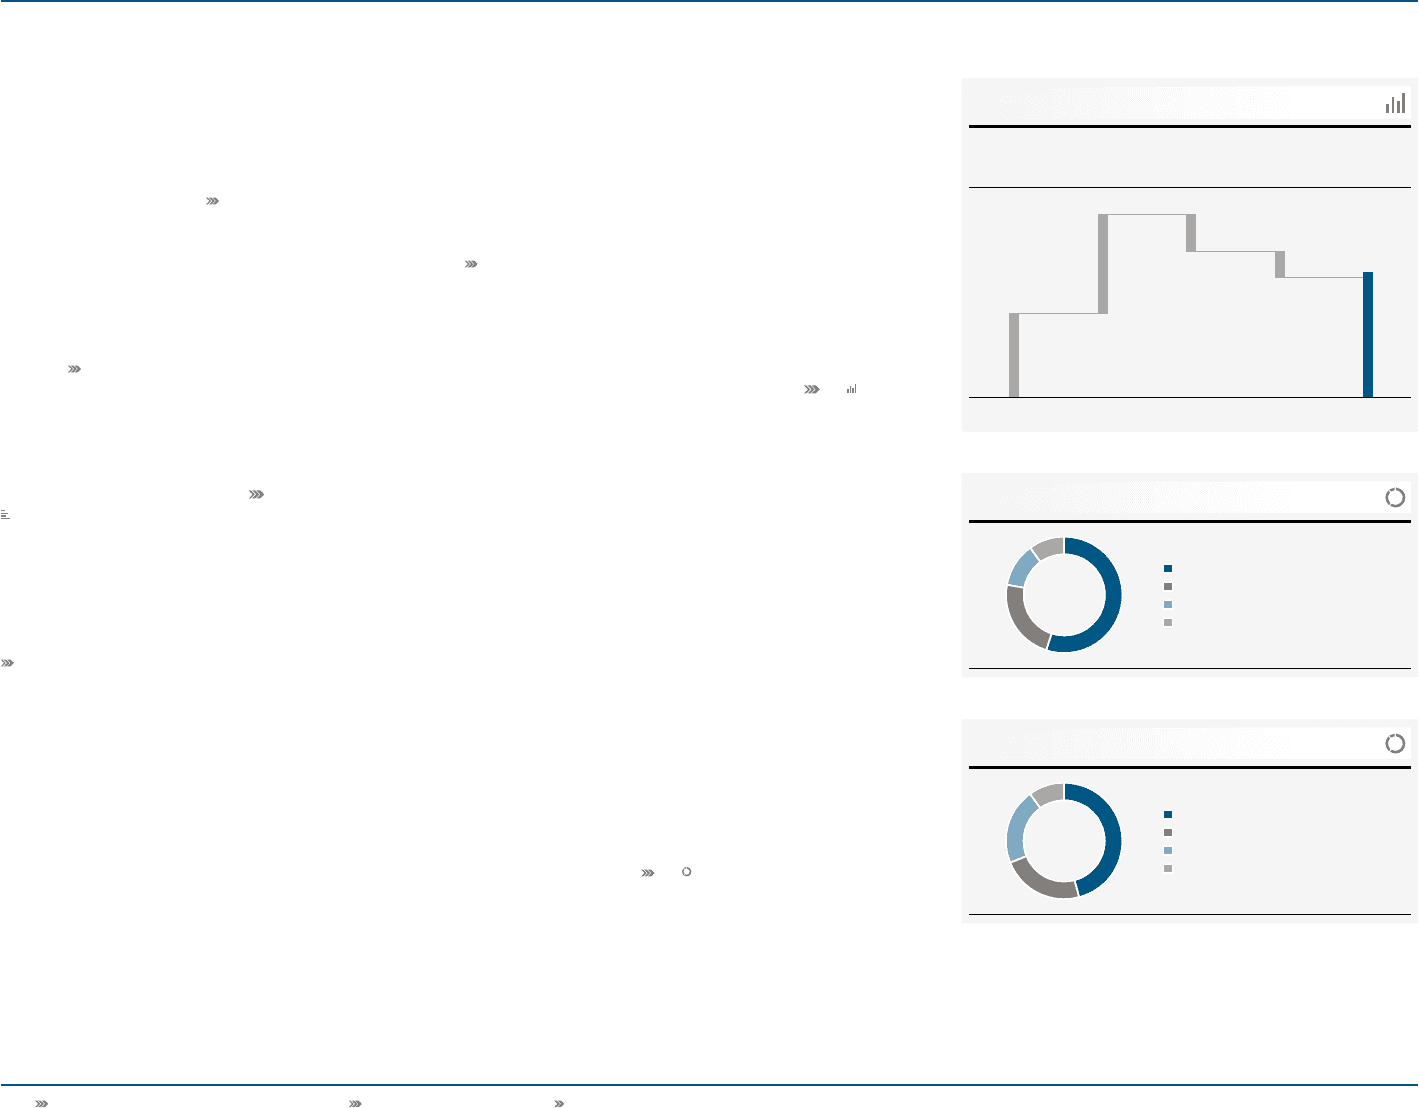
2010 capital expenditure by segment
2010 capital expenditure by type
41
42
55% HQ/Consolidation
23% Retail
12% Wholesale
10% Other Businesses
46% Other
23% Own retail
21% IT
10% Retailer support
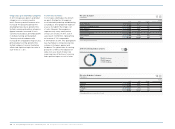
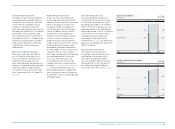
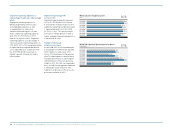
Change in cash and cash equivalents
€ in millions
Cash and cash
equivalents at
the end of 2009
Net cash
generated
from operating
activities
Net cash used
in investing
activities
Net cash used
in financing
activities
Cash and cash
equivalents
at the end
of 2010 1 )
1) Includes a positive exchange rate effect of € 55 million.
40
775
894 (330)
(238)
1,156
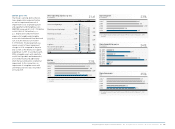
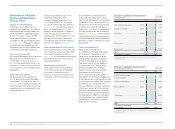
Current accrued liabilities grow 35%
Current accrued liabilities increased 35%
to € 842 million at the end of 2010 from
€ 625 million in 2009, mainly due to an
increase in accruals for payment of goods
and services not yet invoiced see Note 20,
p. 201.
Other current liabilities up 4%
Other current liabilities were up 4% to
€ 241 million at the end of 2010 from
€ 232 million in 2009, mainly due to
increases in customers with credit
balances see Note 21, p. 202.
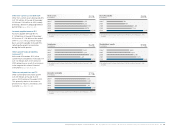
Equity grows due to increase
in net income
Shareholders’ equity rose 22% to
€ 4.616 billion at the end of December
2010 versus € 3.771 billion in 2009 see
39. The net income generated during
the period was the main contributor to
this development. Currency translation
effects in an amount of € 330 million
positively impacted this development,
partly offset by the dividend in an amount
of € 73 million paid during the period
see Note 25, p. 204.
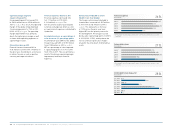
Expenses related to
off-balance sheet items
Our most significant off-balance sheet
commitments are operating leases,
which are related to retail stores, offices,
warehouses and equipment.
The Group has entered into various
operating leases as opposed to property
acquisitions to reduce exposure to
property value fluctuations. Rent
expenses increased 13% to € 544 million
in 2010 from € 480 million in the prior
year, mainly due to the continued
expansion of the adidas Group’s
own-retail activities see Note 27, p. 207.
Cash flow reflects improved
Group profitability
In 2010, net cash inflow from operating
activities was € 894 million (2009:
€ 1.198 billion). The decrease in cash
provided by operating activities compared
to the prior year was primarily due
to higher operating working capital
requirements, partly offset by the
improved Group profitability. Net cash
outflow from investing activities was
€ 330 million (2009: € 162 million).
This was mainly related to spending for
property, plant and equipment such as
investments in the furnishing and fitting
of stores in our Retail segment, in new
office buildings and in IT systems, as well
as to the purchase of short-term financial
assets. Net cash outflow from financing
activities totalled € 238 million (2009:
€ 512 million).
Cash outflows from financing activities
were related to the repayment of short-
term borrowings totalling € 198 million
and dividends paid in an amount of
€ 73 million, partly offset by an increase
in long-term borrowings in an amount
of € 33 million. Exchange rate effects
in an amount of € 55 million positively
impacted the Group’s cash position in
2010 (2009: € 7 million). As a result of
all these developments, cash and cash
equivalents increased by € 381 million
to € 1.156 billion at the end of December
2010 compared to € 775 million at the
end of December 2009 see 40.
Capital expenditure grows 12%
Capital expenditure is the total
cash expenditure for the purchase
of tangible and intangible assets.
Group capital expenditure increased
12% to € 269 million in 2010 (2009:
€ 240 million). The Retail segment
accounted for 23% of Group capital
expenditure (2009: 30%). Investments
primarily related to the expansion
of our store base for the adidas and
Reebok brands. Expenditure in the
Wholesale segment accounted for 12%
of total capital expenditure (2009: 10%).
Capital expenditure in Other Businesses
accounted for 10% of total expenditure
(2009: 6%). The remaining 55% of Group
capital expenditure was recorded in
HQ/Consolidation (2009: 54%) and was
mainly related to investments into new
office buildings and IT infrastructure
see 41 and Global Operations, p. 106.