Reebok 2010 Annual Report Download - page 172
Download and view the complete annual report
Please find page 172 of the 2010 Reebok annual report below. You can navigate through the pages in the report by either clicking on the pages listed below, or by using the keyword search tool below to find specific information within the annual report.-
 1
1 -
2
-
3
-
4
-
5
-
6
-
7
-
8
-
9
-
10
-
11
-
12
-
13
-
14
-
15
-
16
-
17
-
18
-
19
-
20
-
21
-
22
-
23
-
24
-
25
-
26
-
27
-
28
-
29
-
30
-
31
-
32
-
33
-
34
-
35
-
36
-
37
-
38
-
39
-
40
-
41
-
42
-
43
-
44
-
45
-
46
-
47
-
48
-
49
-
50
-
51
-
52
-
53
-
54
-
55
-
56
-
57
-
58
-
59
-
60
-
61
-
62
-
63
-
64
-
65
-
66
-
67
-
68
-
69
-
70
-
71
-
72
-
73
-
74
-
75
-
76
-
77
-
78
-
79
-
80
-
81
-
82
-
83
-
84
-
85
-
86
-
87
-
88
-
89
-
90
-
91
-
92
-
93
-
94
-
95
-
96
-
97
-
98
-
99
-
100
-
101
-
102
-
103
-
104
-
105
-
106
-
107
-
108
-
109
-
110
-
111
-
112
-
113
-
114
-
115
-
116
-
117
-
118
-
119
-
120
-
121
-
122
-
123
-
124
-
125
-
126
-
127
-
128
-
129
-
130
-
131
-
132
-
133
-
134
-
135
-
136
-
137
-
138
-
139
-
140
-
141
-
142
-
143
-
144
-
145
-
146
-
147
-
148
-
149
-
150
-
151
-
152
-
153
-
154
-
155
-
156
-
157
-
158
-
159
-
160
-
161
-
 162
162 -
 163
163 -
 164
164 -
 165
165 -
 166
166 -
 167
167 -
 168
168 -
 169
169 -
 170
170 -
 171
171 -
 172
172 -
 173
173 -
 174
174 -
 175
175 -
 176
176 -
 177
177 -
 178
178 -
 179
179 -
 180
180 -
 181
181 -
 182
182 -
183
-
184
-
185
-
186
-
187
-
188
-
189
-
190
-
191
-
192
-
193
-
194
-
195
-
196
-
197
-
198
-
199
-
200
-
201
-
202
-
203
-
204
-
205
-
206
-
207
-
208
-
209
-
210
-
211
-
212
-
213
-
214
-
215
-
216
-
217
-
218
-
219
-
220
-
221
-
222
-
223
-
224
-
225
-
226
-
227
-
228
-
229
-
230
-
231
-
232
-
233
-
234
-
235
-
236
-
237
-
238
-
239
-
240
-
241
-
242
-
243
-
244
-
245
-
246
-
247
-
248
 |
 |
168 Group Management Report – Financial Review Risk and Opportunity Report
This includes payments to settle obliga-
tions from borrowings as well as cash
outflows from cash-settled derivatives
with negative market values. Financial
liabilities that may be settled in advance
without penalty are included on the
basis of the earliest date of potential
repayment. Cash flows for variable-
interest liabilities are determined with
reference to the conditions at the balance
sheet date.
In 2010, we reduced net debt to
€ 221 million (2009: € 917 million). With
a ratio of net borrowings over 12-month
rolling EBITDA of 0.2 times at year-end,
we are within the Group’s medium-term
guideline of a ratio below two times. In
the light of our available credit lines,
financing structure and business model,
we assess the likelihood of occurrence of
financing and liquidity risks as unlikely,
and therefore expect only a minor
potential financial impact on the Group.
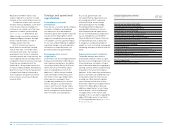
Currency risks
Currency risks for the adidas Group are
a direct result of multi-currency cash
flows within the Group. The biggest
single driver behind this risk results
from the mismatch of the currencies
required for sourcing our products
versus the denominations of our sales.
The vast majority of our sourcing
expenses are in US dollars while sales
are denominated in other currencies to
a large extent – most notably the euro.
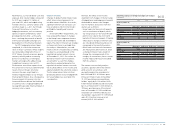
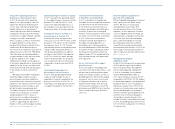
Our main exposures are presented in the
adjacent table see 05. The exposure
from firm commitments and forecasted
transactions was calculated on a
one-year basis.
In line with IFRS 7 requirements, we
have estimated the impact on net income
and shareholders’ equity based on
changes in our most important currency
exchange rates. The calculated impacts
mainly result from fair value changes of
our hedging instruments. The analysis
does not include effects that arise from
the translation of our foreign entities’
financial statements into the Group’s
reporting currency. The sensitivity
analysis is based on the net balance
sheet exposure, including intercompany
balances from monetary assets and
liabilities denominated in foreign
currencies. Moreover, all outstanding
currency derivatives were re-evaluated
using hypothetical foreign exchange rates
to determine the effects on net income
and equity. The analysis was performed
on the same basis for both 2009 and
2010.
Based on this analysis, a 10%
increase in the euro versus the US dollar
at December 31, 2010 would have led
to a € 3 million increase in net income.
The more negative market values of the
US dollar hedges would have decreased
shareholders’ equity by € 157 million.
A 10% weaker euro at December 31,
2010 would have led to a € 4 million
decrease in net income. Share-
holders’ equity would have increased by
€ 193 million see 06. To better reflect
the current foreign exposure structure,
we have included EUR/JPY sensitivity
analysis. Following the change in the
business model in 2010, the exposure
of the currency pair USD/JPY was bifur-
cated into EUR/JPY and EUR/USD. The
impacts of fluctuations of the US dollar
against the Russian rouble and of the
euro against the British pound and the
Japanese yen on net income and share-
holders’ equity are also included in
accordance with IFRS requirements.
However, many other financial and oper-
ational variables that could potentially
reduce the effect of currency fluctua-
tions are excluded from the analysis.
For instance:
− Interest rates, commodity prices and
all other exchange rates are assumed
constant.
− Exchange rates are assumed at a
year-end value instead of the more
relevant sales-weighted average
figure, which we utilise internally to
better reflect both the seasonality of
our business and intra-year currency
fluctuations.
− The underlying forecasted cash flow
exposure (which the hedge instrument
mainly relates to) is not required to be
revalued in this analysis.
− Operational issues, such as potential
discounts to key accounts, which
have high transparency regarding the
impacts of currency on our sourcing
activities (due to their own private label
sourcing efforts), are also excluded
from this presentation.
Utilising a centralised currency risk
management system, our Group
hedges currency needs for projected
sourcing requirements on a rolling 12-
to 24-month basis see Treasury, p. 146.
Our goal is to have the vast majority of
our hedging volume secured six months
prior to the start of a given season. In
rare instances, hedges are contracted
beyond the 24-month horizon. The Group
also largely hedges balance sheet risks.
Due to our strong global position, we are
able to minimise currency risk to a large
extent by utilising natural hedges.
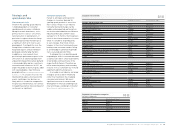
Exposure to foreign exchange risk 1 )
based on notional amounts, € in millions
USD RUB GBP JPY
As at December 31, 2010
Exposure from firm
commitments and
forecasted transactions (3,313) 380 332 325
Balance sheet exposure
including intercompany
exposure (194) 13 (10) 25
Total gross exposure (3,507) 393 322 350
Hedged with other cash flows 166 — — —
Hedged with currency options 576 — (41) —
Hedged with forward contracts 1,733 — (222) (266)
Net exposure (1,032) 393 59 84
As at December 31, 2009
Exposure from firm
commitments and
forecasted transactions 2 ) (2,642) 343 237 199
Balance sheet exposure
including intercompany
exposure (74) (1) 7 0
Total gross exposure (2,716) 342 245 200
Hedged with other cash flows 150 — — —
Hedged with currency options 532 — — (6)
Hedged with forward contracts 1,659 — (260) (120)
Net exposure (375) 342 (15) 73
1) Rounding differences may arise in totals.
2) Adjusted for the USD/RUB forecasted transactions.
05