Reebok 2010 Annual Report Download - page 3
Download and view the complete annual report
Please find page 3 of the 2010 Reebok annual report below. You can navigate through the pages in the report by either clicking on the pages listed below, or by using the keyword search tool below to find specific information within the annual report.-
 1
1 -
 2
2 -
 3
3 -
 4
4 -
 5
5 -
 6
6 -
 7
7 -
 8
8 -
 9
9 -
 10
10 -
 11
11 -
 12
12 -
 13
13 -
 14
14 -
15
-
16
-
17
-
18
-
19
-
20
-
21
-
22
-
23
-
24
-
25
-
26
-
27
-
28
-
29
-
30
-
31
-
32
-
33
-
34
-
35
-
36
-
37
-
38
-
39
-
40
-
41
-
42
-
43
-
44
-
45
-
46
-
47
-
48
-
49
-
50
-
51
-
52
-
53
-
54
-
55
-
56
-
57
-
58
-
59
-
60
-
61
-
62
-
63
-
64
-
65
-
66
-
67
-
68
-
69
-
70
-
71
-
72
-
73
-
74
-
75
-
76
-
77
-
78
-
79
-
80
-
81
-
82
-
83
-
84
-
85
-
86
-
87
-
88
-
89
-
90
-
91
-
92
-
93
-
94
-
95
-
96
-
97
-
98
-
99
-
100
-
101
-
102
-
103
-
104
-
105
-
106
-
107
-
108
-
109
-
110
-
111
-
112
-
113
-
114
-
115
-
116
-
117
-
118
-
119
-
120
-
121
-
122
-
123
-
124
-
125
-
126
-
127
-
128
-
129
-
130
-
131
-
132
-
133
-
134
-
135
-
136
-
137
-
138
-
139
-
140
-
141
-
142
-
143
-
144
-
145
-
146
-
147
-
148
-
149
-
150
-
151
-
152
-
153
-
154
-
155
-
156
-
157
-
158
-
159
-
160
-
161
-
162
-
163
-
164
-
165
-
166
-
167
-
168
-
169
-
170
-
171
-
172
-
173
-
174
-
175
-
176
-
177
-
178
-
179
-
180
-
181
-
182
-
183
-
184
-
185
-
186
-
187
-
188
-
189
-
190
-
191
-
192
-
193
-
194
-
195
-
196
-
197
-
198
-
199
-
200
-
201
-
202
-
203
-
204
-
205
-
206
-
207
-
208
-
209
-
210
-
211
-
212
-
213
-
214
-
215
-
216
-
217
-
218
-
219
-
220
-
221
-
222
-
223
-
224
-
225
-
226
-
227
-
228
-
229
-
230
-
231
-
232
-
233
-
234
-
235
-
236
-
237
-
238
-
239
-
240
-
241
-
242
-
243
-
244
-
245
-
246
-
247
-
248
 |
 |
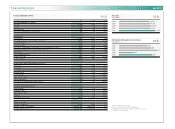
Financial Highlights 2010
Financial Highlights (IFRS)
2010 2009 Change
Operating Highlights (€ in millions)
Net sales 11,990 10,381 15.5%
EBITDA 1,159 780 48.6%
Operating profit 894 508 76.0%
Net income attributable to shareholders 567 245 131.1%
Key Ratios (%)
Gross margin 47.8% 45.4% 2.4pp
Operating expenses as a percentage of net sales 42.1% 42.3% (0.2pp)
Operating margin 7.5% 4.9% 2.6pp
Effective tax rate 29.5% 31.5% (2.0pp)
Net income attributable to shareholders as a percentage of net sales 4.7% 2.4% 2.4pp
Operating working capital as a percentage of net sales 1 ) 20.8% 24.3% (3.5pp)
Equity ratio 43.5% 42.5% 1.0pp
Net borrowings/EBITDA 0.2 1.2
Financial leverage 4.8% 24.3% (19.5pp)
Return on equity 12.3% 6.5% 5.8pp
Balance Sheet and Cash Flow Data (€ in millions)
Total assets 10,618 8,875 19.6%
Inventories 2,119 1,471 44.1%
Receivables and other current assets 2,324 2,038 14.0%
Working capital 1,972 1,649 19.6%
Net borrowings 221 917 (75.9%)
Shareholders' equity 4,616 3,771 22.4%
Capital expenditure 269 240 11.8%
Net cash generated from operating activities 894 1,198 (25.3%)
Per Share of Common Stock (€)
Basic earnings 2.71 1.25 116.8%
Diluted earnings 2.71 1.22 121.8%
Operating cash flow 4.28 6.11 (30.0%)
Dividend 0.802) 0.35 128.6%
Share price at year-end 48.89 37.77 29.4%
Other (at year-end)
Number of employees 42,541 39,596 7.4%
Number of shares outstanding 209,216,186 209,216,186 0.0%
Average number of shares 209,216,186 196,220,166 6.6%
01
1) Twelve-month trailing average.
2) Subject to Annual General Meeting approval.
3) Including Reebok, Rockport and Reebok-CCM Hockey from
February 1, 2006 onwards.
Net sales
€ in millions
Net income attributable to shareholders
€ in millions
02
03
2006 3 )
2007
2008
2009
2010
2006 3 )
2007
2008
2009
2010
10,084
10,299
10,799
10,381
11,990
483
551
642
245
567