Reebok 2010 Annual Report Download - page 197
Download and view the complete annual report
Please find page 197 of the 2010 Reebok annual report below. You can navigate through the pages in the report by either clicking on the pages listed below, or by using the keyword search tool below to find specific information within the annual report.-
 1
1 -
2
-
3
-
4
-
5
-
6
-
7
-
8
-
9
-
10
-
11
-
12
-
13
-
14
-
15
-
16
-
17
-
18
-
19
-
20
-
21
-
22
-
23
-
24
-
25
-
26
-
27
-
28
-
29
-
30
-
31
-
32
-
33
-
34
-
35
-
36
-
37
-
38
-
39
-
40
-
41
-
42
-
43
-
44
-
45
-
46
-
47
-
48
-
49
-
50
-
51
-
52
-
53
-
54
-
55
-
56
-
57
-
58
-
59
-
60
-
61
-
62
-
63
-
64
-
65
-
66
-
67
-
68
-
69
-
70
-
71
-
72
-
73
-
74
-
75
-
76
-
77
-
78
-
79
-
80
-
81
-
82
-
83
-
84
-
85
-
86
-
87
-
88
-
89
-
90
-
91
-
92
-
93
-
94
-
95
-
96
-
97
-
98
-
99
-
100
-
101
-
102
-
103
-
104
-
105
-
106
-
107
-
108
-
109
-
110
-
111
-
112
-
113
-
114
-
115
-
116
-
117
-
118
-
119
-
120
-
121
-
122
-
123
-
124
-
125
-
126
-
127
-
128
-
129
-
130
-
131
-
132
-
133
-
134
-
135
-
136
-
137
-
138
-
139
-
140
-
141
-
142
-
143
-
144
-
145
-
146
-
147
-
148
-
149
-
150
-
151
-
152
-
153
-
154
-
155
-
156
-
157
-
158
-
159
-
160
-
161
-
162
-
163
-
164
-
165
-
166
-
167
-
168
-
169
-
170
-
171
-
172
-
173
-
174
-
175
-
176
-
177
-
178
-
179
-
180
-
181
-
182
-
183
-
184
-
185
-
186
-
 187
187 -
 188
188 -
 189
189 -
 190
190 -
 191
191 -
 192
192 -
 193
193 -
 194
194 -
 195
195 -
 196
196 -
 197
197 -
 198
198 -
 199
199 -
 200
200 -
 201
201 -
 202
202 -
 203
203 -
 204
204 -
 205
205 -
 206
206 -
 207
207 -
208
-
209
-
210
-
211
-
212
-
213
-
214
-
215
-
216
-
217
-
218
-
219
-
220
-
221
-
222
-
223
-
224
-
225
-
226
-
227
-
228
-
229
-
230
-
231
-
232
-
233
-
234
-
235
-
236
-
237
-
238
-
239
-
240
-
241
-
242
-
243
-
244
-
245
-
246
-
247
-
248
 |
 |

Consolidated Financial Statements Notes 193
The recoverable amount of a cash-generating unit is determined on the basis of value in use.
This calculation uses cash flow projections based on the financial planning covering a five-year
period in total. The planning is based on the strategic business plan of the adidas Group “Route
2015” as communicated on November 8, 2010 see Subsequent Events and Outlook, p. 174 and reflects
an expected mid- to high-single-digit sales increase for the majority of the cash-generating units
(or groups of units). For a few emerging markets, we expect, on average, a low-double-digit sales
growth rate. Furthermore, we expect the operating margin to improve primarily driven by a slight
improvement in the gross margin as well as lower operating expenses as a percentage of sales.
The planning for capital expenditure and working capital is primarily based on past experience.
The planning for future tax payments is based on current statutory corporate tax rates of the
single cash-generating units (or groups of units). Cash flows beyond this period are extrapolated
using steady growth rates of 1.7% (2009: 1.7%). According to our expectations, these growth rates
do not exceed the long-term average growth rate of the business in which each cash-generating
unit operates.
Discount rates are based on a weighted average cost of capital calculation considering a five-
year average market-weighted debt/equity structure and financing costs referencing the Group’s
major competitors for each cash-generating unit (or group of units). The discount rates used are
after-tax rates and reflect the specific equity and country risk of the relevant cash-generating unit.
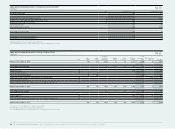
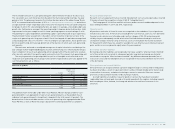
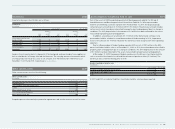
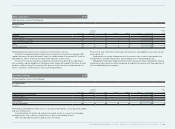
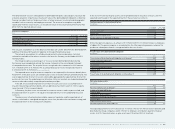
The carrying amounts of acquired goodwill as well as of intangible assets allocated to the
respective cash-generating unit (or group of units) and the respective discount rates applied to the
cash flow projections are as follows:
Allocation of goodwill
Goodwill
(€ in millions)
Intangible assets
with indefinite
useful lives
(€ in millions) Discount rate
TaylorMade-adidas Golf 284 27 7.6%
Greater China 221 247 8.3%
Other Asian Markets 167 169 7.9 – 11.0%
Western Europe 538 323 7.1 – 10.2%
Other Cash-generating Units 329 681 6.4 – 11.0%
Total 1,539 1,447
The goodwill shown in the table under Other Asian Markets, Western Europe and Other Cash-
generating Units is an aggregation of several cash-generating units, as the goodwill of each
individual cash-generating unit is insignificant compared to the total amount of goodwill. The
determination of the recoverable amounts of the cash-generating units aggregated under Other
Asian Markets as well as Western Europe is based on the same key parameter assumptions.
Research and development Research and development
Research costs are expensed in full as incurred. Development costs are also expensed as incurred
if they do not meet the recognition criteria of IAS 38 “Intangible Assets”.
The Group spent € 102 million and € 86 million on product research and development for the
years ending December 31, 2010 and 2009, respectively.
Financial assets Financial assets
All purchases and sales of financial assets are recognised on the trade date. Costs of purchases
include transaction costs. If the fair value of available-for-sale financial assets (i.e. non-derivative
financial assets which are not allocable under another category of IAS 39) can be measured
reliably, they are subsequently carried at fair value. Realised and unrealised gains and losses
arising from changes in the fair value of financial assets are included in the income statement
for the period in which they arise, except for available-for-sale financial assets where unrealised
gains and losses are recognised in equity unless they are impaired.
Borrowings and other liabilities Borrowings and other liabilities
Borrowings and other liabilities are recognised at fair value using the “effective interest method”,
net of transaction costs incurred. In subsequent periods, long-term borrowings are stated at
amortised cost using the “effective interest method”. Any difference between proceeds (net of
transaction costs) and the redemption value is recognised in the income statement over the term
of the borrowing.
Other provisions and accrued liabilitiesOther provisions and accrued liabilities
Other provisions are recognised where a present obligation (legal or constructive) to third parties
has been incurred as a result of a past event which can be estimated reliably and is likely to lead
to an outflow of resources, and where the timing or amount is uncertain. Other non-current
provisions are discounted if the effect of discounting is material.
Accrued liabilities are liabilities to pay for goods or services that have been received or
supplied but have not been paid, invoiced or formally agreed with the supplier, including amounts
due to employees. Here, however, the timing and amount of an outflow of resources is not
uncertain.