Reebok 2010 Annual Report Download - page 140
Download and view the complete annual report
Please find page 140 of the 2010 Reebok annual report below. You can navigate through the pages in the report by either clicking on the pages listed below, or by using the keyword search tool below to find specific information within the annual report.-
 1
1 -
2
-
3
-
4
-
5
-
6
-
7
-
8
-
9
-
10
-
11
-
12
-
13
-
14
-
15
-
16
-
17
-
18
-
19
-
20
-
21
-
22
-
23
-
24
-
25
-
26
-
27
-
28
-
29
-
30
-
31
-
32
-
33
-
34
-
35
-
36
-
37
-
38
-
39
-
40
-
41
-
42
-
43
-
44
-
45
-
46
-
47
-
48
-
49
-
50
-
51
-
52
-
53
-
54
-
55
-
56
-
57
-
58
-
59
-
60
-
61
-
62
-
63
-
64
-
65
-
66
-
67
-
68
-
69
-
70
-
71
-
72
-
73
-
74
-
75
-
76
-
77
-
78
-
79
-
80
-
81
-
82
-
83
-
84
-
85
-
86
-
87
-
88
-
89
-
90
-
91
-
92
-
93
-
94
-
95
-
96
-
97
-
98
-
99
-
100
-
101
-
102
-
103
-
104
-
105
-
106
-
107
-
108
-
109
-
110
-
111
-
112
-
113
-
114
-
115
-
116
-
117
-
118
-
119
-
120
-
121
-
122
-
123
-
124
-
125
-
126
-
127
-
128
-
129
-
 130
130 -
 131
131 -
 132
132 -
 133
133 -
 134
134 -
 135
135 -
 136
136 -
 137
137 -
 138
138 -
 139
139 -
 140
140 -
 141
141 -
 142
142 -
 143
143 -
 144
144 -
 145
145 -
 146
146 -
 147
147 -
 148
148 -
 149
149 -
 150
150 -
151
-
152
-
153
-
154
-
155
-
156
-
157
-
158
-
159
-
160
-
161
-
162
-
163
-
164
-
165
-
166
-
167
-
168
-
169
-
170
-
171
-
172
-
173
-
174
-
175
-
176
-
177
-
178
-
179
-
180
-
181
-
182
-
183
-
184
-
185
-
186
-
187
-
188
-
189
-
190
-
191
-
192
-
193
-
194
-
195
-
196
-
197
-
198
-
199
-
200
-
201
-
202
-
203
-
204
-
205
-
206
-
207
-
208
-
209
-
210
-
211
-
212
-
213
-
214
-
215
-
216
-
217
-
218
-
219
-
220
-
221
-
222
-
223
-
224
-
225
-
226
-
227
-
228
-
229
-
230
-
231
-
232
-
233
-
234
-
235
-
236
-
237
-
238
-
239
-
240
-
241
-
242
-
243
-
244
-
245
-
246
-
247
-
248
 |
 |
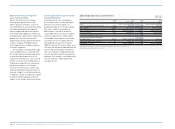
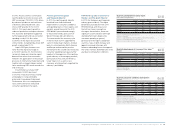
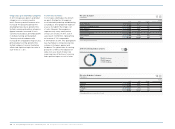
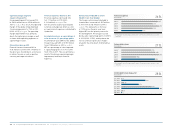
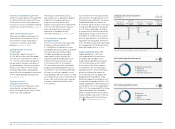
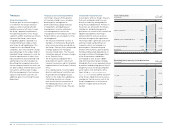
136 Group Management Report – Financial Review Group Business Performance Income Statement
Other operating expenses
€ in millions
1) Including Reebok, Rockport and Reebok-CCM Hockey from February 1, 2006
onwards.
17
2006 1 )
2007
2008
2009
2010
3,759
4,115
4,378
4,390
5,046
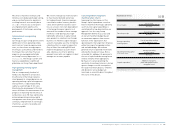
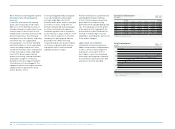
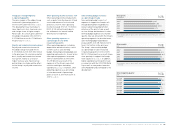
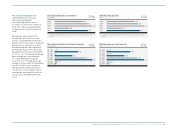
Other operating expenses
in % of net sales
1) Including Reebok, Rockport and Reebok-CCM Hockey from February 1, 2006
onwards.
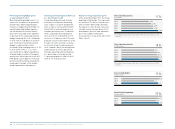
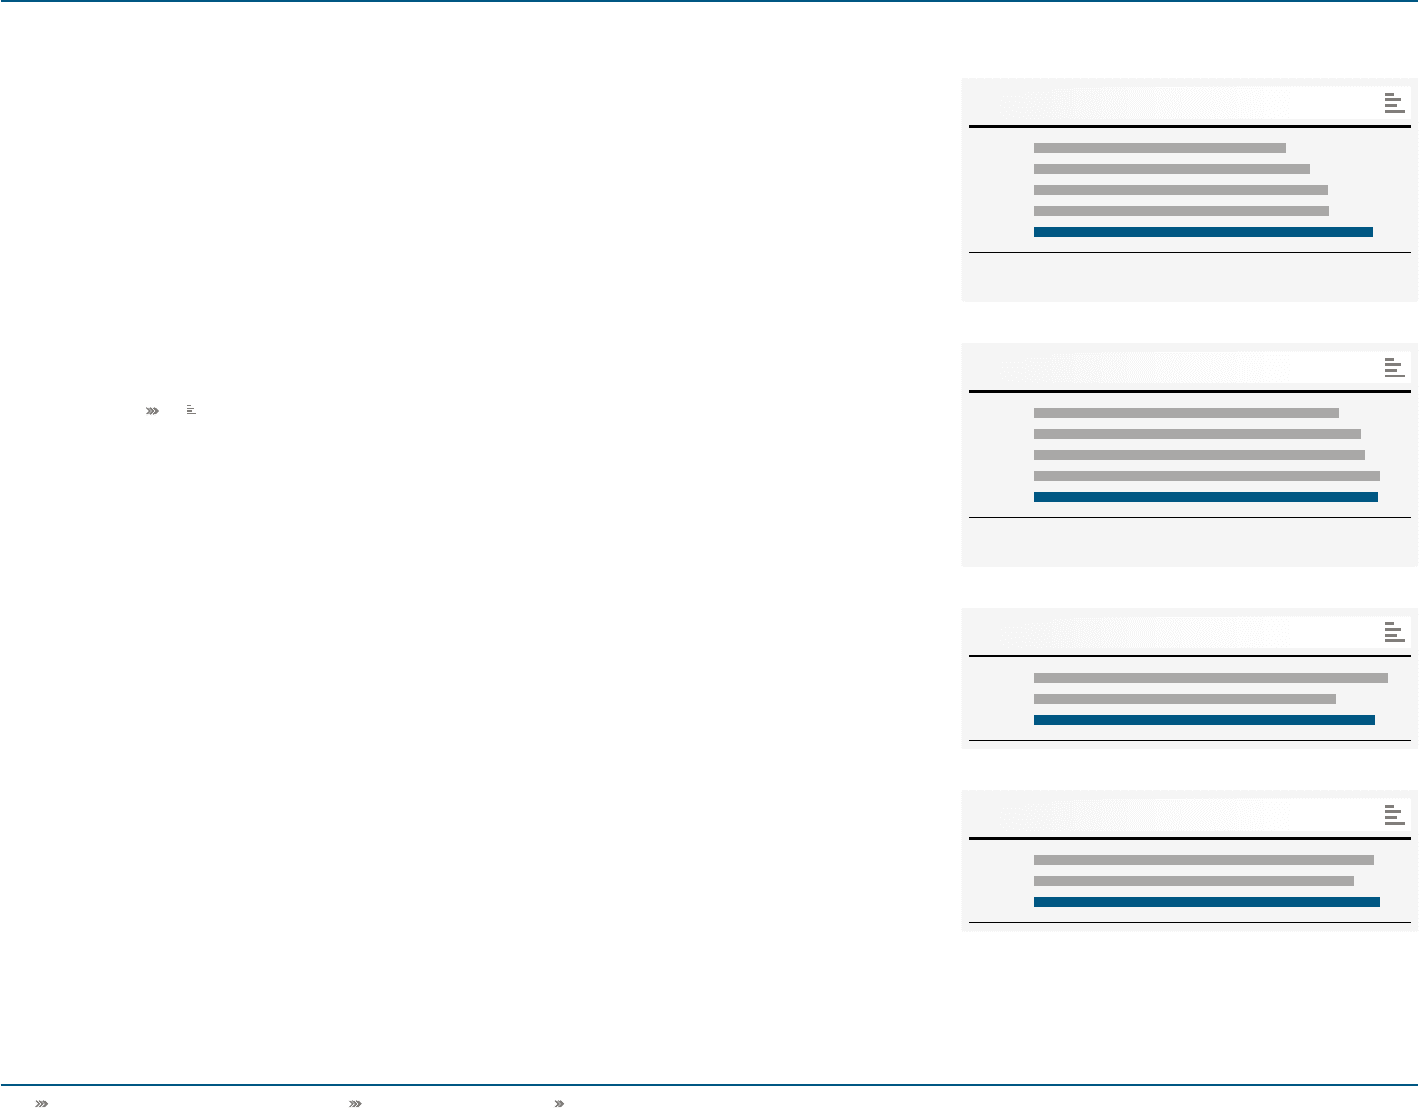
Sales working budget
in % of net sales
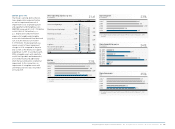
Marketing working budget
in % of net sales
18
19
20
2006 1 )
2007
2008
2009
2010
2008
2009
2010
2008
2009
2010
37.3
40.0
40.5
42.3
42.1
2.7
2.3
2.6
10.5
9.9
10.7
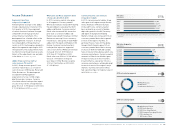
Marketing working budget grows
as a percentage of sales
Marketing working budget consists of
items such as expenses for promotion
partnerships, advertising and public
relations to support brand strength. As
marketing working budget expenses
are not distribution channel-specific,
they are not allocated to the segments.
In absolute terms, marketing working
budget increased 25% to € 1.288 billion
in 2010 from € 1.028 billion in the prior
year. The Group’s marketing working
budget as a percentage of sales
increased 0.8 percentage points to 10.7%
in 2010 (2009: 9.9%) see 20. This
was mainly due to higher expenditures
at brand adidas in order to leverage its
presence as official sponsor at the 2010
FIFA World Cup. In addition, increased
promotion and marketing initiatives for
new product concepts at the Reebok
brand impacted this development.
Operating overhead expenses decrease
as a percentage of sales
Group operating overheads include
overhead costs related to marketing,
sales, logistics, research and develop-
ment as well as central administration.
Almost half of overhead expenses are
related to personnel costs. In absolute
terms, operating overhead expenses
were up 11% to € 3.450 billion in 2010
versus € 3.121 billion in 2009. This was
primarily a result of the expansion of the
Group’s own-retail activities, as well as
an increase in logistic and warehouse
costs. However, due to increasing Retail
sophistication as well as operational
leverage, operating overhead expenses
as a percentage of sales decreased
1.3 percentage points to 28.8% in 2010
from 30.1% in the prior year.
Number of Group employees up 7%
At the end of December 2010, the Group
employed 42,541 people. This represents
an increase of 7% versus the prior year
level of 39,596. New hirings related to
the expansion of the Group’s own-retail
store base were the main driver of this
development. On a full-time equivalent
basis, the number of employees
increased 6% to 36,444 at the end of 2010
(2009: 34,437).