Reebok 2010 Annual Report Download - page 133
Download and view the complete annual report
Please find page 133 of the 2010 Reebok annual report below. You can navigate through the pages in the report by either clicking on the pages listed below, or by using the keyword search tool below to find specific information within the annual report.-
 1
1 -
2
-
3
-
4
-
5
-
6
-
7
-
8
-
9
-
10
-
11
-
12
-
13
-
14
-
15
-
16
-
17
-
18
-
19
-
20
-
21
-
22
-
23
-
24
-
25
-
26
-
27
-
28
-
29
-
30
-
31
-
32
-
33
-
34
-
35
-
36
-
37
-
38
-
39
-
40
-
41
-
42
-
43
-
44
-
45
-
46
-
47
-
48
-
49
-
50
-
51
-
52
-
53
-
54
-
55
-
56
-
57
-
58
-
59
-
60
-
61
-
62
-
63
-
64
-
65
-
66
-
67
-
68
-
69
-
70
-
71
-
72
-
73
-
74
-
75
-
76
-
77
-
78
-
79
-
80
-
81
-
82
-
83
-
84
-
85
-
86
-
87
-
88
-
89
-
90
-
91
-
92
-
93
-
94
-
95
-
96
-
97
-
98
-
99
-
100
-
101
-
102
-
103
-
104
-
105
-
106
-
107
-
108
-
109
-
110
-
111
-
112
-
113
-
114
-
115
-
116
-
117
-
118
-
119
-
120
-
121
-
122
-
 123
123 -
 124
124 -
 125
125 -
 126
126 -
 127
127 -
 128
128 -
 129
129 -
 130
130 -
 131
131 -
 132
132 -
 133
133 -
 134
134 -
 135
135 -
 136
136 -
 137
137 -
 138
138 -
 139
139 -
 140
140 -
 141
141 -
 142
142 -
 143
143 -
144
-
145
-
146
-
147
-
148
-
149
-
150
-
151
-
152
-
153
-
154
-
155
-
156
-
157
-
158
-
159
-
160
-
161
-
162
-
163
-
164
-
165
-
166
-
167
-
168
-
169
-
170
-
171
-
172
-
173
-
174
-
175
-
176
-
177
-
178
-
179
-
180
-
181
-
182
-
183
-
184
-
185
-
186
-
187
-
188
-
189
-
190
-
191
-
192
-
193
-
194
-
195
-
196
-
197
-
198
-
199
-
200
-
201
-
202
-
203
-
204
-
205
-
206
-
207
-
208
-
209
-
210
-
211
-
212
-
213
-
214
-
215
-
216
-
217
-
218
-
219
-
220
-
221
-
222
-
223
-
224
-
225
-
226
-
227
-
228
-
229
-
230
-
231
-
232
-
233
-
234
-
235
-
236
-
237
-
238
-
239
-
240
-
241
-
242
-
243
-
244
-
245
-
246
-
247
-
248
 |
 |

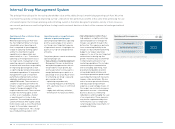
Group Management Report – Financial Review Internal Group Management System 129
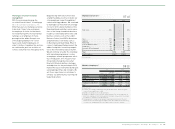
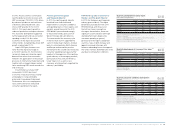
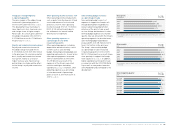
Structured performance
measurement system
Our Group has developed an extensive
performance measurement system,
which utilises a variety of tools to
measure the performance of the adidas
Group. The Group’s key financial metrics
are monitored and compared against
budget on a monthly basis. The focus
is on operating cash flow, CACC, sales,
operating margin, operating working
capital and net debt development
see 02. When negative deviations
exist between actual and target numbers,
we perform a detailed analysis to
identify and address the cause. We also
benchmark our Group’s financial results
with those of our major competitors
on a quarterly basis. To assess current
sales and profitability development,
Management analyses sell-through
information from our own-retail
distribution as well as short-term
replenishment orders from retailers.
Taking into account year-to-date
performance as well as opportunities
and risks, the Group’s full year financial
performance is forecasted on a quarterly
basis.
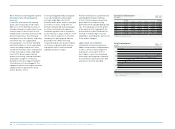
In this respect, backlogs comprising
orders received up to nine months in
advance of the actual sale are used as an
indicator. However, due to the growing
share of own retail in our business mix
as well as fluctuating order patterns
among our wholesale partners, our order
books are less indicative of anticipated
revenues compared to the past. As a
result of the growing share of at-once
business, qualitative feedback from
our retail partners on the success of
our collections at the point of sale is
becoming even more important. As an
early indicator for future performance,
we also conduct market research to
measure brand appeal, brand awareness
and resulting purchase intent.
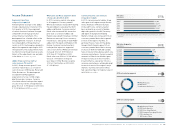
Management appraisal of
performance and targets
We communicate our Group’s financial
targets on an annual basis. We also
provide updates throughout the year as
appropriate. In 2010, Group sales and
net income increased significantly. While
Retail revenues increased at double-
digit rates, sales in the Wholesale
segment and in Other Businesses grew
at single-digit rates. Increased Retail
sales in the emerging markets resulted
in Group revenues exceeding our initial
guidance of a low- to mid-single-digit
increase. Group sales development
outperformed macroeconomic and global
industry growth see Economic and Sector
Development, p. 130, mainly due to strong
sales increases in most geographical
areas.
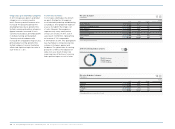
Profitability increased at a higher rate
than originally anticipated as a result
of higher gross margins partly due to
the strong performance of our Retail
segment. As a result of continued focus
on operating working capital and cash
management, we achieved all of our
goals related to balance sheet improve-
ments in 2010.
Our expectations for the Group’s
business performance in 2011 are based
on the assumption of an improvement in
the global economy, a strengthening of
our business in the emerging markets
and a strong product pipeline which
has received favourable reviews from
retailers. This, as well as an improved
balance sheet, should lead to increases
in sales and earnings per share in 2011.
Profitability improvements, however,
will be dampened by increasing raw
material and labour costs which our
industry is facing. In 2012 and beyond,
assuming further improvements in the
global economy, we are confident to
further increase sales and earnings per
share as outlined under our Route 2015
strategic business plan. We believe that
our outlook is realistic within the scope
of the current trading environment. No
material event between the end of 2010
and the publication of this report has
altered our view see Subsequent Events
and Outlook, p. 174.