Reebok 2010 Annual Report Download - page 207
Download and view the complete annual report
Please find page 207 of the 2010 Reebok annual report below. You can navigate through the pages in the report by either clicking on the pages listed below, or by using the keyword search tool below to find specific information within the annual report.-
 1
1 -
2
-
3
-
4
-
5
-
6
-
7
-
8
-
9
-
10
-
11
-
12
-
13
-
14
-
15
-
16
-
17
-
18
-
19
-
20
-
21
-
22
-
23
-
24
-
25
-
26
-
27
-
28
-
29
-
30
-
31
-
32
-
33
-
34
-
35
-
36
-
37
-
38
-
39
-
40
-
41
-
42
-
43
-
44
-
45
-
46
-
47
-
48
-
49
-
50
-
51
-
52
-
53
-
54
-
55
-
56
-
57
-
58
-
59
-
60
-
61
-
62
-
63
-
64
-
65
-
66
-
67
-
68
-
69
-
70
-
71
-
72
-
73
-
74
-
75
-
76
-
77
-
78
-
79
-
80
-
81
-
82
-
83
-
84
-
85
-
86
-
87
-
88
-
89
-
90
-
91
-
92
-
93
-
94
-
95
-
96
-
97
-
98
-
99
-
100
-
101
-
102
-
103
-
104
-
105
-
106
-
107
-
108
-
109
-
110
-
111
-
112
-
113
-
114
-
115
-
116
-
117
-
118
-
119
-
120
-
121
-
122
-
123
-
124
-
125
-
126
-
127
-
128
-
129
-
130
-
131
-
132
-
133
-
134
-
135
-
136
-
137
-
138
-
139
-
140
-
141
-
142
-
143
-
144
-
145
-
146
-
147
-
148
-
149
-
150
-
151
-
152
-
153
-
154
-
155
-
156
-
157
-
158
-
159
-
160
-
161
-
162
-
163
-
164
-
165
-
166
-
167
-
168
-
169
-
170
-
171
-
172
-
173
-
174
-
175
-
176
-
177
-
178
-
179
-
180
-
181
-
182
-
183
-
184
-
185
-
186
-
187
-
188
-
189
-
190
-
191
-
192
-
193
-
194
-
195
-
196
-
 197
197 -
 198
198 -
 199
199 -
 200
200 -
 201
201 -
 202
202 -
 203
203 -
 204
204 -
 205
205 -
 206
206 -
 207
207 -
 208
208 -
 209
209 -
 210
210 -
 211
211 -
 212
212 -
 213
213 -
 214
214 -
 215
215 -
 216
216 -
 217
217 -
218
-
219
-
220
-
221
-
222
-
223
-
224
-
225
-
226
-
227
-
228
-
229
-
230
-
231
-
232
-
233
-
234
-
235
-
236
-
237
-
238
-
239
-
240
-
241
-
242
-
243
-
244
-
245
-
246
-
247
-
248
 |
 |

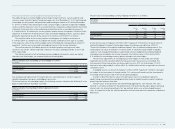
Consolidated Financial Statements Notes Notes to the Consolidated Statement of Financial Position 203
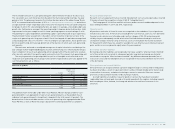
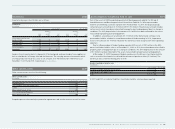
The determination of assets and liabilities for defined benefit plans is based upon statistical and
actuarial valuations. In particular, the present value of the defined benefit obligation is driven by
financial variables (such as the discount rates or future increases in salaries) and demographic
variables (such as mortality and employee turnover). The actuarial assumptions may differ
significantly from the actual results, i.e. the present value of the actual future performance may
differ from the reported present value.
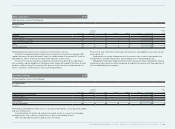
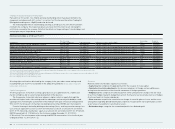
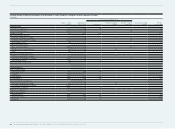
Actuarial assumptions
in %
Dec. 31, 2010 Dec. 31, 2009
Discount rate 4.6 5.0
Expected rate of salary increases 3.3 3.3
Expected pension increases 2.0 2.0
Expected return on plan assets 5.3 5.4
The actuarial assumptions as at the balance sheet date are used to determine the defined benefit
liability at that date and the pension expense for the upcoming financial year.
The actuarial assumptions for withdrawal and mortality rates are based on statistical
information available in the various countries, the latter for Germany on the Heubeck 2005 G
mortality tables.
The Group recognises actuarial gains or losses arising in defined benefit plans during
the financial year immediately outside the income statement in the consolidated statement
of comprehensive income. The actuarial losses recognised in this statement for 2010 amount
to € 13 million (2009: € 16 million). The accumulated actuarial losses recognised amount to
€ 38 million (2009: € 25 million) see also Note 25.
The expected return on plan assets assumption is set separately for the various benefit plans.
Around 90% of the plan assets are related to plan assets in the UK, Germany and Switzerland. The
overall expected rate of return on assets is derived by aggregating the expected rate of return for
each asset class over the underlying asset allocation. Historical markets are studied and expected
returns are based on widely accepted capital market principles.
In the UK, the assumed long-term rate of return on each asset class is assumed to be in
line with long-term government bonds, with an additional investment return of 3.5% for equity
securities and 1.0% for corporate bonds.
In Germany, the plan assets are invested in insurance contracts and in a pension fund, and
the expected return on assets is set equal to the expected return on the underlying insurance
contracts.
The plan assets in Switzerland are held by a pension foundation and the expected rate of
return is calculated as a weighted average per asset class, based on the investment strategy and
the expected return on the varying asset categories.
In the rest of the world, the plan assets consist predominantly of insurance contracts, with the
expected return based on the expected return on these insurance contracts.
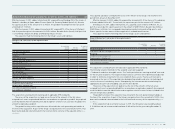
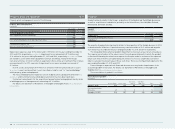
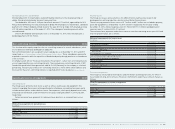
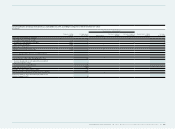
Pension expenses for defined benefit plans
€ in millions
Year ending
Dec. 31, 2010 Year ending
Dec. 31, 2009
Current service cost 11 11
Interest cost 10 10
Expected return on plan assets (4) (3)
Pension expenses for defined benefit plans 17 18
Of the total pension expenses, an amount of € 13 million (2009: € 13 million) relates to employees
of adidas AG. The pension expense is recorded within the other operating expenses whereas the
production-related part thereof is recognised within the cost of sales.
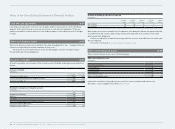
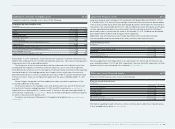
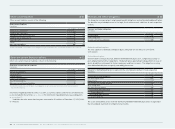
Present value of the defined benefit obligation
€ in millions
2010 2009
Present value of the defined benefit obligation as at January 1 207 172
Currency translation differences 7 3
Current service cost 11 11
Interest cost 10 10
Contribution by plan participants 0 0
Pensions paid (12) (8)
Actuarial loss 14 19
Present value of the defined benefit obligation as at December 31 237 207
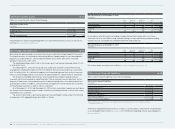
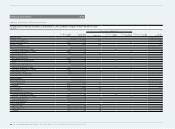
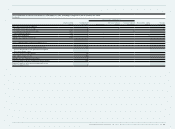
Fair value of plan assets
€ in millions
2010 2009
Fair value of plan assets at January 1 61 53
Currency translation differences 3 2
Pensions paid (5) (3)
Contributions by the employer 3 3
Contributions paid by plan participants 0 0
Actuarial gain 1 3
Expected return on plan assets 4 3
Fair value of plan assets at December 31 67 61
The expected payments for 2011 amount to € 10 million. Thereof € 7 million relate to benefits paid
directly by the Group companies and € 3 million to employer contributions paid into the plan
assets. In 2010, the actual return on plan assets was € 5 million (2009: € 6 million).