Reebok 2010 Annual Report Download - page 134
Download and view the complete annual report
Please find page 134 of the 2010 Reebok annual report below. You can navigate through the pages in the report by either clicking on the pages listed below, or by using the keyword search tool below to find specific information within the annual report.-
 1
1 -
2
-
3
-
4
-
5
-
6
-
7
-
8
-
9
-
10
-
11
-
12
-
13
-
14
-
15
-
16
-
17
-
18
-
19
-
20
-
21
-
22
-
23
-
24
-
25
-
26
-
27
-
28
-
29
-
30
-
31
-
32
-
33
-
34
-
35
-
36
-
37
-
38
-
39
-
40
-
41
-
42
-
43
-
44
-
45
-
46
-
47
-
48
-
49
-
50
-
51
-
52
-
53
-
54
-
55
-
56
-
57
-
58
-
59
-
60
-
61
-
62
-
63
-
64
-
65
-
66
-
67
-
68
-
69
-
70
-
71
-
72
-
73
-
74
-
75
-
76
-
77
-
78
-
79
-
80
-
81
-
82
-
83
-
84
-
85
-
86
-
87
-
88
-
89
-
90
-
91
-
92
-
93
-
94
-
95
-
96
-
97
-
98
-
99
-
100
-
101
-
102
-
103
-
104
-
105
-
106
-
107
-
108
-
109
-
110
-
111
-
112
-
113
-
114
-
115
-
116
-
117
-
118
-
119
-
120
-
121
-
122
-
123
-
 124
124 -
 125
125 -
 126
126 -
 127
127 -
 128
128 -
 129
129 -
 130
130 -
 131
131 -
 132
132 -
 133
133 -
 134
134 -
 135
135 -
 136
136 -
 137
137 -
 138
138 -
 139
139 -
 140
140 -
 141
141 -
 142
142 -
 143
143 -
 144
144 -
145
-
146
-
147
-
148
-
149
-
150
-
151
-
152
-
153
-
154
-
155
-
156
-
157
-
158
-
159
-
160
-
161
-
162
-
163
-
164
-
165
-
166
-
167
-
168
-
169
-
170
-
171
-
172
-
173
-
174
-
175
-
176
-
177
-
178
-
179
-
180
-
181
-
182
-
183
-
184
-
185
-
186
-
187
-
188
-
189
-
190
-
191
-
192
-
193
-
194
-
195
-
196
-
197
-
198
-
199
-
200
-
201
-
202
-
203
-
204
-
205
-
206
-
207
-
208
-
209
-
210
-
211
-
212
-
213
-
214
-
215
-
216
-
217
-
218
-
219
-
220
-
221
-
222
-
223
-
224
-
225
-
226
-
227
-
228
-
229
-
230
-
231
-
232
-
233
-
234
-
235
-
236
-
237
-
238
-
239
-
240
-
241
-
242
-
243
-
244
-
245
-
246
-
247
-
248
 |
 |
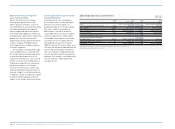
130 Group Management Report – Financial Review Group Business Performance Economic and Sector Development
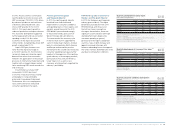
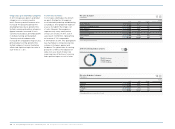
Group Business Performance
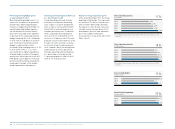
In 2010, the adidas Group results improved significantly compared to the prior year. Currency-neutral Group sales increased
9% as a result of growth in the Wholesale and Retail segments as well as in Other Businesses. In euro terms, adidas Group
revenues grew 15% to € 11.990 billion from € 10.381 billion in 2009. The Group’s gross margin increased 2.4 percentage points
to 47.8% (2009: 45.4%), supported by less clearance sales and a larger share of higher-margin Retail sales. Consequently, the
Group’s gross profit rose 22% to € 5.730 billion in 2010 versus € 4.712 billion in 2009. The Group’s operating margin improved
2.6 percentage points to 7.5% from 4.9% in 2009, primarily due to the higher gross margin as well as lower other operating
expenses as a percentage of sales. The Group’s operating profit grew 76% to € 894 million in 2010 versus € 508 million in
2009. The Group’s net income attributable to shareholders increased 131% to € 567 million from € 245 million in 2009. Diluted
earnings per share grew 122% to € 2.71 in 2010 versus € 1.22 in 2009.
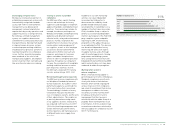
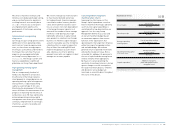
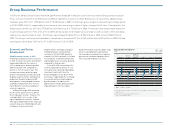
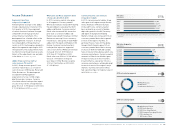
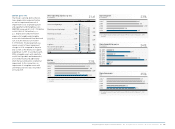
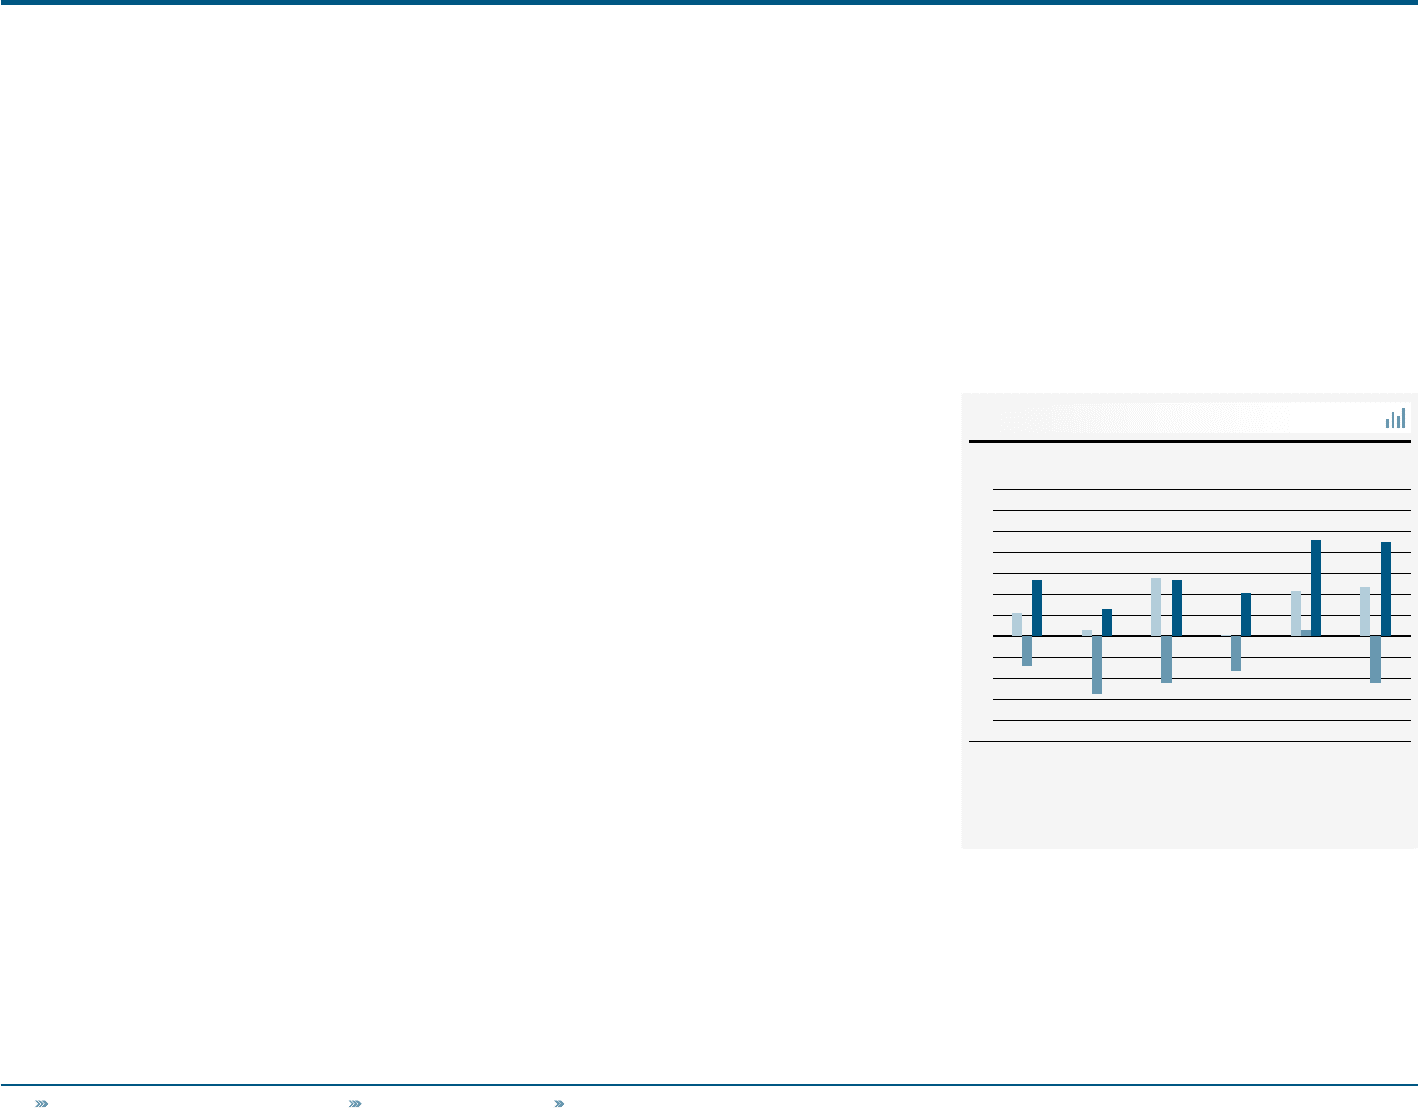
Regional GDP development 1 )
in %
Global Western
Europe
European
Emerging
Markets USA Asia 2 ) Latin America
9
6
3
0
(3)
(6)
—
2008
—
2009
—
2010
1) Real, percentage change versus prior year; 2009 figures restated compared
to prior year.
2) Asia also includes Japan and Area Pacific.
Source: World Bank, HSBC.
01
Economic and Sector
Development
Global economy recovers in 2010
Following the global economic recession
in 2009, the macroeconomic environment
improved notably over the course of
2010 as global gross domestic product
(GDP) increased 3.9% compared to a
decline of 2.2% in the prior year. This
recovery was mainly driven by rapid
growth in emerging economies, boosted
by global export activities and industrial
production. Despite the positive GDP
developments, sovereign debt concerns
and high unemployment rates in most
major Western economies weighed on
economic expansion.
In Western Europe, GDP increased
by 1.8% (2009: decline of 4.1%), driven
by strong export volumes. However, the
sovereign debt crisis, in some of the
region’s peripheral countries, coupled
with high unemployment levels and acute
austerity measures inhibited growth and
confidence in many economies.
Despite similar challenges, European
emerging markets continued their
recovery in 2010 with GDP growth of
around 3.9% (2009: decline of 3.4%), due
to rising levels of fixed investment and
improving domestic consumer demand
compared to the prior year.
In the USA, GDP increased by 2.9%
in 2010 compared to a decline of 2.6%
in the prior year, driven by rebounding
investment levels, both from the
private and public sector. Much of this
activity was supported by the continued
fiscal and monetary stimuli adopted
by policymakers. In addition, the
depreciation of the US dollar positively
impacted exports from the region.
Despite the overall economic upturn, high
levels of unemployment and relatively
low house prices remained as a negative
pressure on consumer spending, which
only increased modestly in the year.