Reebok 2010 Annual Report Download - page 137
Download and view the complete annual report
Please find page 137 of the 2010 Reebok annual report below. You can navigate through the pages in the report by either clicking on the pages listed below, or by using the keyword search tool below to find specific information within the annual report.-
 1
1 -
2
-
3
-
4
-
5
-
6
-
7
-
8
-
9
-
10
-
11
-
12
-
13
-
14
-
15
-
16
-
17
-
18
-
19
-
20
-
21
-
22
-
23
-
24
-
25
-
26
-
27
-
28
-
29
-
30
-
31
-
32
-
33
-
34
-
35
-
36
-
37
-
38
-
39
-
40
-
41
-
42
-
43
-
44
-
45
-
46
-
47
-
48
-
49
-
50
-
51
-
52
-
53
-
54
-
55
-
56
-
57
-
58
-
59
-
60
-
61
-
62
-
63
-
64
-
65
-
66
-
67
-
68
-
69
-
70
-
71
-
72
-
73
-
74
-
75
-
76
-
77
-
78
-
79
-
80
-
81
-
82
-
83
-
84
-
85
-
86
-
87
-
88
-
89
-
90
-
91
-
92
-
93
-
94
-
95
-
96
-
97
-
98
-
99
-
100
-
101
-
102
-
103
-
104
-
105
-
106
-
107
-
108
-
109
-
110
-
111
-
112
-
113
-
114
-
115
-
116
-
117
-
118
-
119
-
120
-
121
-
122
-
123
-
124
-
125
-
126
-
 127
127 -
 128
128 -
 129
129 -
 130
130 -
 131
131 -
 132
132 -
 133
133 -
 134
134 -
 135
135 -
 136
136 -
 137
137 -
 138
138 -
 139
139 -
 140
140 -
 141
141 -
 142
142 -
 143
143 -
 144
144 -
 145
145 -
 146
146 -
 147
147 -
148
-
149
-
150
-
151
-
152
-
153
-
154
-
155
-
156
-
157
-
158
-
159
-
160
-
161
-
162
-
163
-
164
-
165
-
166
-
167
-
168
-
169
-
170
-
171
-
172
-
173
-
174
-
175
-
176
-
177
-
178
-
179
-
180
-
181
-
182
-
183
-
184
-
185
-
186
-
187
-
188
-
189
-
190
-
191
-
192
-
193
-
194
-
195
-
196
-
197
-
198
-
199
-
200
-
201
-
202
-
203
-
204
-
205
-
206
-
207
-
208
-
209
-
210
-
211
-
212
-
213
-
214
-
215
-
216
-
217
-
218
-
219
-
220
-
221
-
222
-
223
-
224
-
225
-
226
-
227
-
228
-
229
-
230
-
231
-
232
-
233
-
234
-
235
-
236
-
237
-
238
-
239
-
240
-
241
-
242
-
243
-
244
-
245
-
246
-
247
-
248
 |
 |
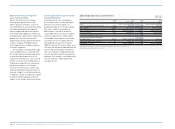
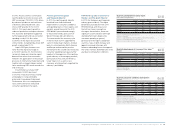
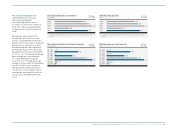
Group Management Report – Financial Review Group Business Performance Income Statement 133
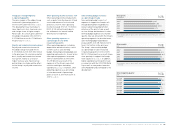
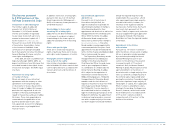
Net sales
€ in millions
1) Including Reebok, Rockport and Reebok-CCM Hockey from February 1, 2006
onwards.
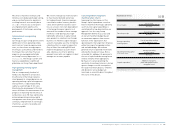
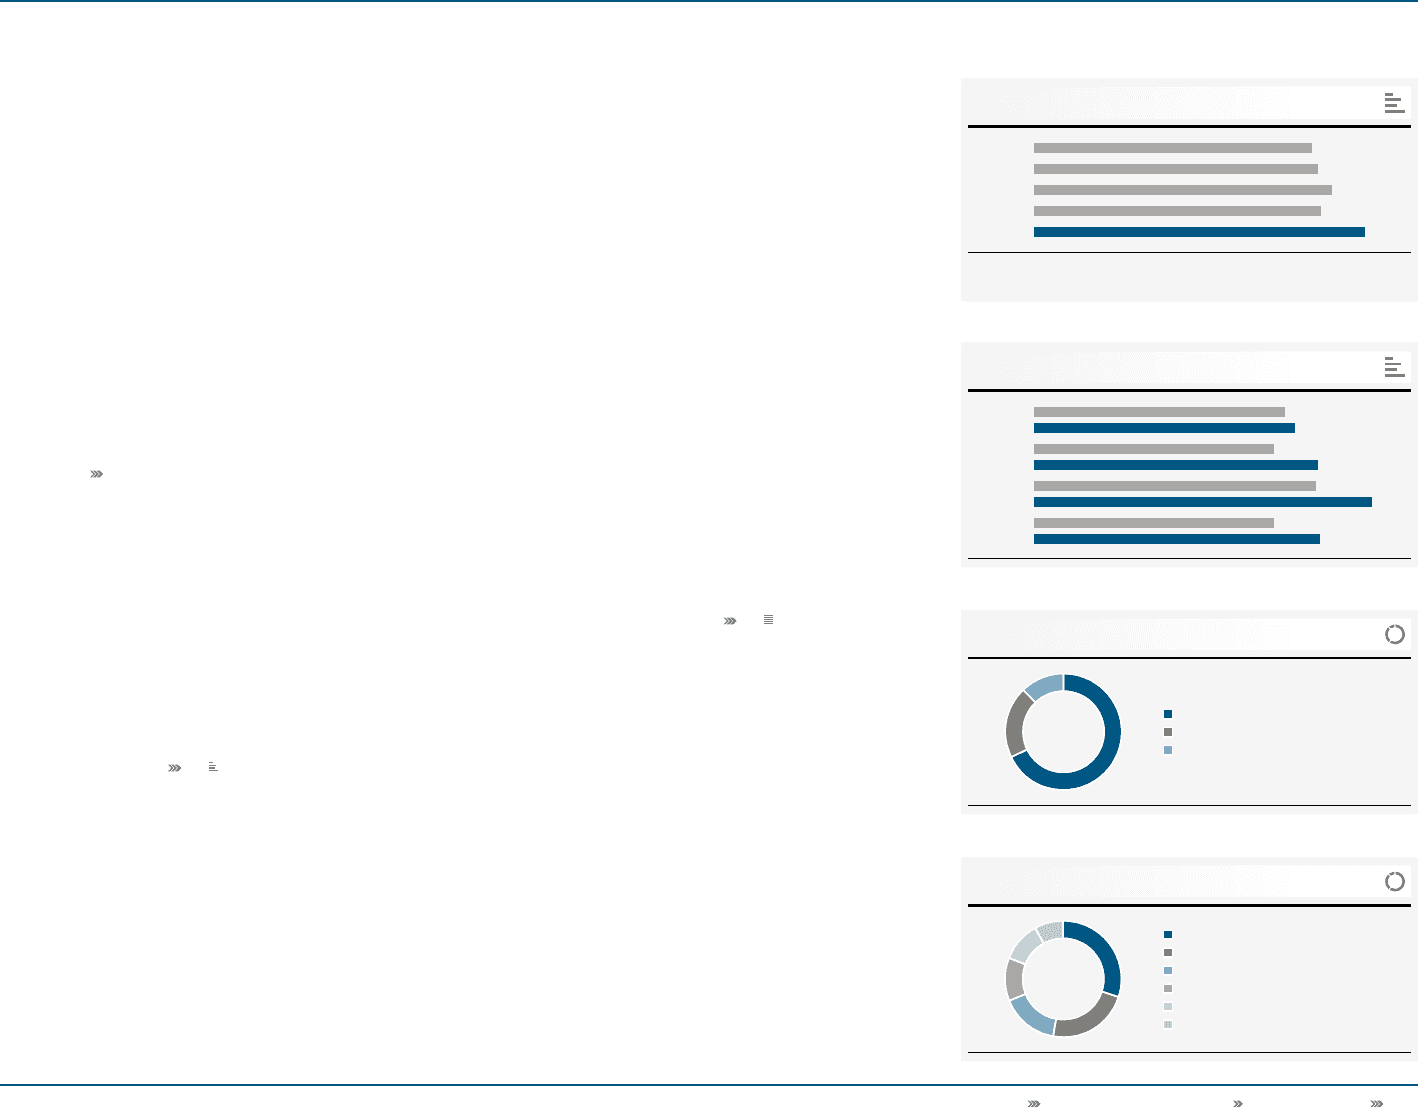
Net sales by quarter
€ in millions
07
08
2006 1 )
2007
2008
2009
2010
10,084
10,299
10,799
10,381
11,990
Q1 2009
Q1 2010
Q2 2009
Q2 2010
Q3 2009
Q3 2010
Q4 2009
Q4 2010
2,577
2,674
2,457 2,917
2,888 3,468
2,458 2,931
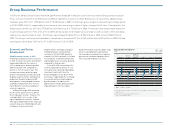
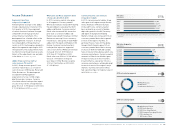
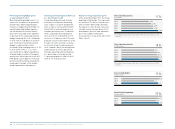
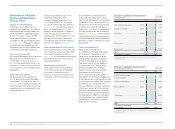
2010 net sales by segment 09
68% Wholesale
20% Retail
12% Other Businesses
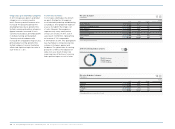
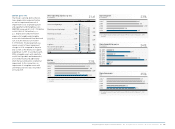
2010 net sales by region 10
30% Western Europe
23% North America
16% Other Asian Markets
12% European Emerging Markets
11% Latin America
8% Greater China
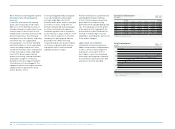
Income Statement
Segmental reporting
comparatives updated
Following minor changes to the adidas
Group’s organisational structure in the
first quarter of 2010, the assignment
of certain functions has been changed
compared to the Group’s prior year
annual financial statements. This
development has a limited effect on the
Group segmental structure. To ensure
full comparability of Group financial
results in 2010, the Group has decided to
adjust the segmental reporting for 2009
retrospectively. These adjustments have
no effect on total Group financial results.
Details of the adjustments are available
in the Notes see Note 35, p. 218.
adidas Group currency-neutral
sales increase 9% in 2010
In 2010, Group revenues grew 9% on a
currency-neutral basis, as a result of
sales increases in Wholesale, Retail and
Other Businesses. This development
exceeded initial Management
expectations of a low- to mid-single-
digit Group sales increase. Currency
translation effects had a positive impact
on sales in euro terms. Group revenues
grew 15% to € 11.990 billion in 2010 from
€ 10.381 billion in 2009 see 07.
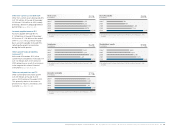
Wholesale and Retail segments drive
strong sales growth in 2010
In 2010, currency-neutral sales grew
in all segments. Currency-neutral
Wholesale revenues increased 8% during
the period due to sales growth at both
adidas and Reebok. Currency-neutral
Retail sales increased 18% versus the
prior year as a result of adidas and
Reebok sales growth. Revenues in Other
Businesses were up 2% on a currency-
neutral basis. Sales grew at TaylorMade-
adidas Golf, Rockport and Reebok-CCM
Hockey. Currency translation effects
had a positive impact on segmental
sales in euro terms. Wholesale revenues
increased 14% to € 8.181 billion in
2010 from € 7.164 billion in 2009.
Retail sales rose 25% to € 2.389 billion
versus € 1.906 billion in the prior
year. Sales in Other Businesses grew
10% to € 1.420 billion in 2010 (2009:
€ 1.293 billion).
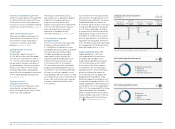
Currency-neutral sales increase
in nearly all regions
In 2010, currency-neutral adidas Group
sales grew in all regions except Greater
China. Revenues in Western Europe
increased 7% on a currency-neutral
basis, primarily as a result of double-
digit sales growth in the UK, Germany
and Spain. In European Emerging
Markets, Group sales increased 16% on
a currency-neutral basis due to growth
in most of the region’s markets, in
particular Russia. Sales for the adidas
Group in North America grew 12% on
a currency-neutral basis due to strong
increases in both the USA and Canada.
Sales in Greater China decreased 2% on a
currency-neutral basis. Currency-neutral
revenues in Other Asian Markets grew
6% due to increases in most markets.
In Latin America, sales grew 14% on a
currency-neutral basis, with double-digit
increases in most of the region’s major
markets. Currency translation effects
had a positive impact on regional sales in
euro terms see 11.