Reebok 2010 Annual Report Download - page 159
Download and view the complete annual report
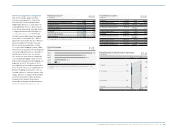
Please find page 159 of the 2010 Reebok annual report below. You can navigate through the pages in the report by either clicking on the pages listed below, or by using the keyword search tool below to find specific information within the annual report.-
 1
1 -
2
-
3
-
4
-
5
-
6
-
7
-
8
-
9
-
10
-
11
-
12
-
13
-
14
-
15
-
16
-
17
-
18
-
19
-
20
-
21
-
22
-
23
-
24
-
25
-
26
-
27
-
28
-
29
-
30
-
31
-
32
-
33
-
34
-
35
-
36
-
37
-
38
-
39
-
40
-
41
-
42
-
43
-
44
-
45
-
46
-
47
-
48
-
49
-
50
-
51
-
52
-
53
-
54
-
55
-
56
-
57
-
58
-
59
-
60
-
61
-
62
-
63
-
64
-
65
-
66
-
67
-
68
-
69
-
70
-
71
-
72
-
73
-
74
-
75
-
76
-
77
-
78
-
79
-
80
-
81
-
82
-
83
-
84
-
85
-
86
-
87
-
88
-
89
-
90
-
91
-
92
-
93
-
94
-
95
-
96
-
97
-
98
-
99
-
100
-
101
-
102
-
103
-
104
-
105
-
106
-
107
-
108
-
109
-
110
-
111
-
112
-
113
-
114
-
115
-
116
-
117
-
118
-
119
-
120
-
121
-
122
-
123
-
124
-
125
-
126
-
127
-
128
-
129
-
130
-
131
-
132
-
133
-
134
-
135
-
136
-
137
-
138
-
139
-
140
-
141
-
142
-
143
-
144
-
145
-
146
-
147
-
148
-
 149
149 -
 150
150 -
 151
151 -
 152
152 -
 153
153 -
 154
154 -
 155
155 -
 156
156 -
 157
157 -
 158
158 -
 159
159 -
 160
160 -
 161
161 -
 162
162 -
 163
163 -
 164
164 -
 165
165 -
 166
166 -
 167
167 -
 168
168 -
 169
169 -
170
-
171
-
172
-
173
-
174
-
175
-
176
-
177
-
178
-
179
-
180
-
181
-
182
-
183
-
184
-
185
-
186
-
187
-
188
-
189
-
190
-
191
-
192
-
193
-
194
-
195
-
196
-
197
-
198
-
199
-
200
-
201
-
202
-
203
-
204
-
205
-
206
-
207
-
208
-
209
-
210
-
211
-
212
-
213
-
214
-
215
-
216
-
217
-
218
-
219
-
220
-
221
-
222
-
223
-
224
-
225
-
226
-
227
-
228
-
229
-
230
-
231
-
232
-
233
-
234
-
235
-
236
-
237
-
238
-
239
-
240
-
241
-
242
-
243
-
244
-
245
-
246
-
247
-
248
 |
 |
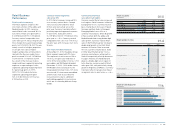
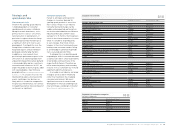
Group Management Report – Financial Review Business Performance by Segment Retail Business Performance 155
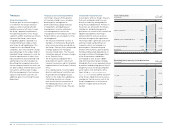
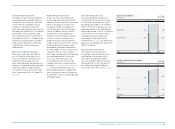
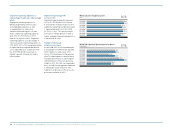
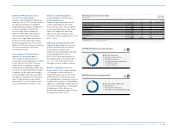
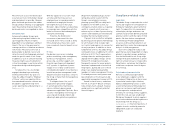
Retail gross margin by quarter
in %
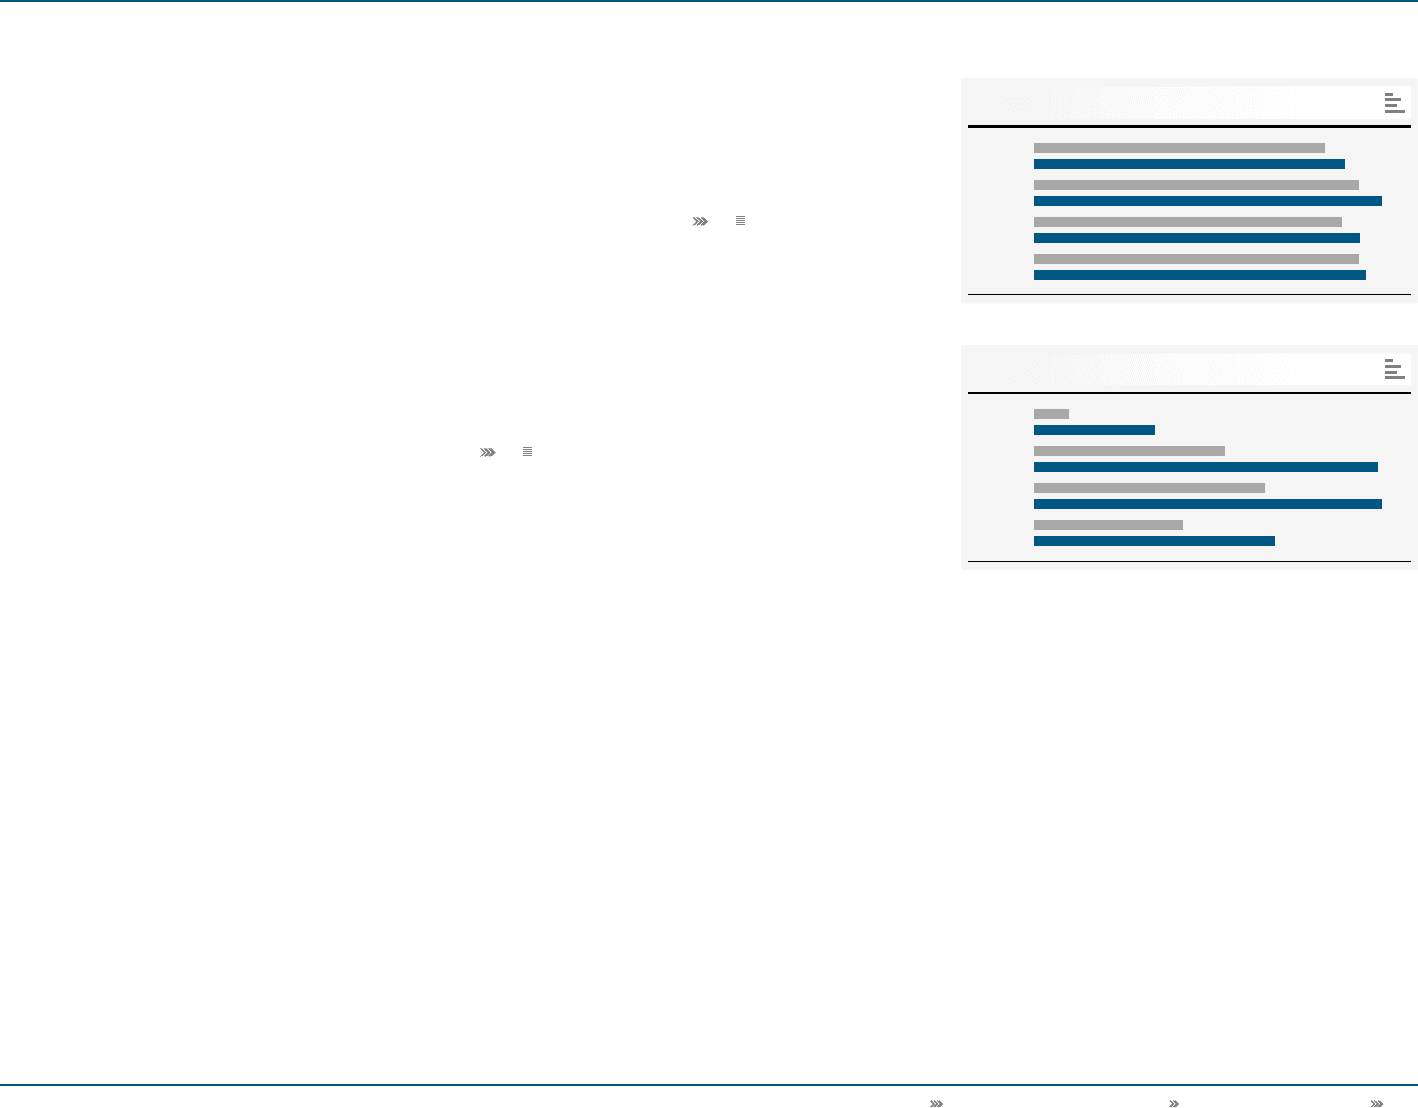
Retail segmental operating profit by quarter
€ in millions
14
15
Q1 2009
Q1 2010
Q2 2009
Q2 2010
Q3 2009
Q3 2010
Q4 2009
Q4 2010
Q1 2009
Q1 2010
Q2 2009
Q2 2010
Q3 2009
Q3 2010
Q4 2009
Q4 2010
54.5
58.2
60.8
65.1
57.6
60.9
60.7
62.1
15 52
82 147
99 149
64 103
adidas and Reebok branded
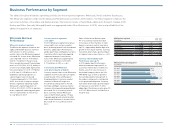
Retail sales increase
In 2010, adidas Group Retail sales
increased at a double-digit rate at both
adidas and Reebok. Currency-neutral
adidas Sport Performance revenues grew
15% in the period. adidas Sport Style
sales rose 29% versus the prior year
on a currency-neutral basis. Currency-
neutral Reebok sales were 14% higher
compared to the prior year. Comparable
store sales for the adidas brand
increased 11% on a currency-neutral
basis, driven by double-digit growth
in the training, football and running
categories. Comparable store sales
for Reebok grew 11%, driven by strong
growth in training and running. Currency
translation effects had a positive
impact on revenues in euro terms.
adidas Sport Performance own-retail
sales increased 23% to € 1.404 billion
in 2010 from € 1.142 billion in 2009.
adidas Sport Style own-retail sales
were up 37% to € 575 million in 2010
from € 420 million in 2009. Own-retail
sales of Reebok branded products grew
20% to € 408 million in 2010 (2009:
€ 339 million).
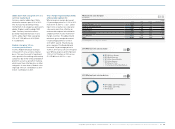
Retail gross margin improves
3.2 percentage points
Gross margin in the Retail segment
increased 3.2 percentage points to
61.8% in 2010 from 58.6% in 2009, with
improvements in all store formats.
This was mainly a result of a higher
proportion of concept store sales at
higher margins. Gross margin was also
positively impacted by the appreciation
of the Russian rouble. By brand, the
adidas gross margin grew 2.4 percentage
points to 63.2% (2009: 60.9%) and
Reebok’s gross margin improved
6.7 percentage points to 54.8% (2009:
48.1%). Retail gross profit increased
32% to € 1.476 billion in 2010 from
€ 1.116 billion in 2009 see 08.
Segmental operating expenses
as a percentage of sales down
2.1 percentage points
Segmental operating expenses in Retail
primarily relate to personnel and rent
expenses as well as the sales working
budget. Segmental operating expenses
increased 19% to € 1.024 billion in
2010 from € 857 million in 2009. This
was a result of higher sales working
budget expenses and higher expenses
related to the expansion of the Group’s
store base, particularly in emerging
markets. Segmental operating expenses
as a percentage of sales declined
2.1 percentage points to 42.9% (2009:
45.0%), as a result of operating leverage
in the segment.
Segmental operating profit up 74%
Segmental operating profit increased
74% to € 452 million in 2010 versus
€ 259 million in the prior year.
Segmental operating margin improved
5.3 percentage points to 18.9% (2009:
13.6%) see 08. This was a result of
the gross margin increase and lower
segmental operating expenses as
a percentage of sales.
Retail employee base grows
On December 31, 2010, the Group
employed 22,286 people in the Retail
segment. This represents an increase
of 14% versus 19,576 employees at the
end of the prior year. The increase in
the number of employees relates to the
expansion of the Group’s store base.
The majority of employees in Retail are
employed on a part-time basis. On a
full-time equivalent basis, the number of
people employed in Retail grew 12% to
17,017 at the end of 2010 (2009: 15,229).