Reebok 2010 Annual Report Download - page 142
Download and view the complete annual report
Please find page 142 of the 2010 Reebok annual report below. You can navigate through the pages in the report by either clicking on the pages listed below, or by using the keyword search tool below to find specific information within the annual report.-
 1
1 -
2
-
3
-
4
-
5
-
6
-
7
-
8
-
9
-
10
-
11
-
12
-
13
-
14
-
15
-
16
-
17
-
18
-
19
-
20
-
21
-
22
-
23
-
24
-
25
-
26
-
27
-
28
-
29
-
30
-
31
-
32
-
33
-
34
-
35
-
36
-
37
-
38
-
39
-
40
-
41
-
42
-
43
-
44
-
45
-
46
-
47
-
48
-
49
-
50
-
51
-
52
-
53
-
54
-
55
-
56
-
57
-
58
-
59
-
60
-
61
-
62
-
63
-
64
-
65
-
66
-
67
-
68
-
69
-
70
-
71
-
72
-
73
-
74
-
75
-
76
-
77
-
78
-
79
-
80
-
81
-
82
-
83
-
84
-
85
-
86
-
87
-
88
-
89
-
90
-
91
-
92
-
93
-
94
-
95
-
96
-
97
-
98
-
99
-
100
-
101
-
102
-
103
-
104
-
105
-
106
-
107
-
108
-
109
-
110
-
111
-
112
-
113
-
114
-
115
-
116
-
117
-
118
-
119
-
120
-
121
-
122
-
123
-
124
-
125
-
126
-
127
-
128
-
129
-
130
-
131
-
 132
132 -
 133
133 -
 134
134 -
 135
135 -
 136
136 -
 137
137 -
 138
138 -
 139
139 -
 140
140 -
 141
141 -
 142
142 -
 143
143 -
 144
144 -
 145
145 -
 146
146 -
 147
147 -
 148
148 -
 149
149 -
 150
150 -
 151
151 -
 152
152 -
153
-
154
-
155
-
156
-
157
-
158
-
159
-
160
-
161
-
162
-
163
-
164
-
165
-
166
-
167
-
168
-
169
-
170
-
171
-
172
-
173
-
174
-
175
-
176
-
177
-
178
-
179
-
180
-
181
-
182
-
183
-
184
-
185
-
186
-
187
-
188
-
189
-
190
-
191
-
192
-
193
-
194
-
195
-
196
-
197
-
198
-
199
-
200
-
201
-
202
-
203
-
204
-
205
-
206
-
207
-
208
-
209
-
210
-
211
-
212
-
213
-
214
-
215
-
216
-
217
-
218
-
219
-
220
-
221
-
222
-
223
-
224
-
225
-
226
-
227
-
228
-
229
-
230
-
231
-
232
-
233
-
234
-
235
-
236
-
237
-
238
-
239
-
240
-
241
-
242
-
243
-
244
-
245
-
246
-
247
-
248
 |
 |
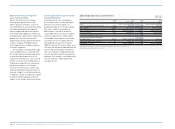
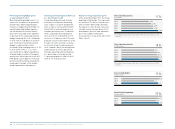
138 Group Management Report – Financial Review Group Business Performance Income Statement
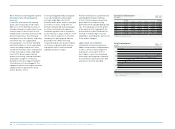
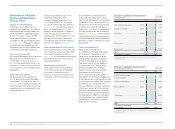
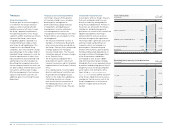
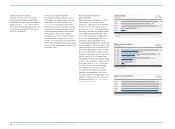
Financial expenses
€ in millions
1) Including Reebok, Rockport and Reebok-CCM Hockey from February 1, 2006
onwards.
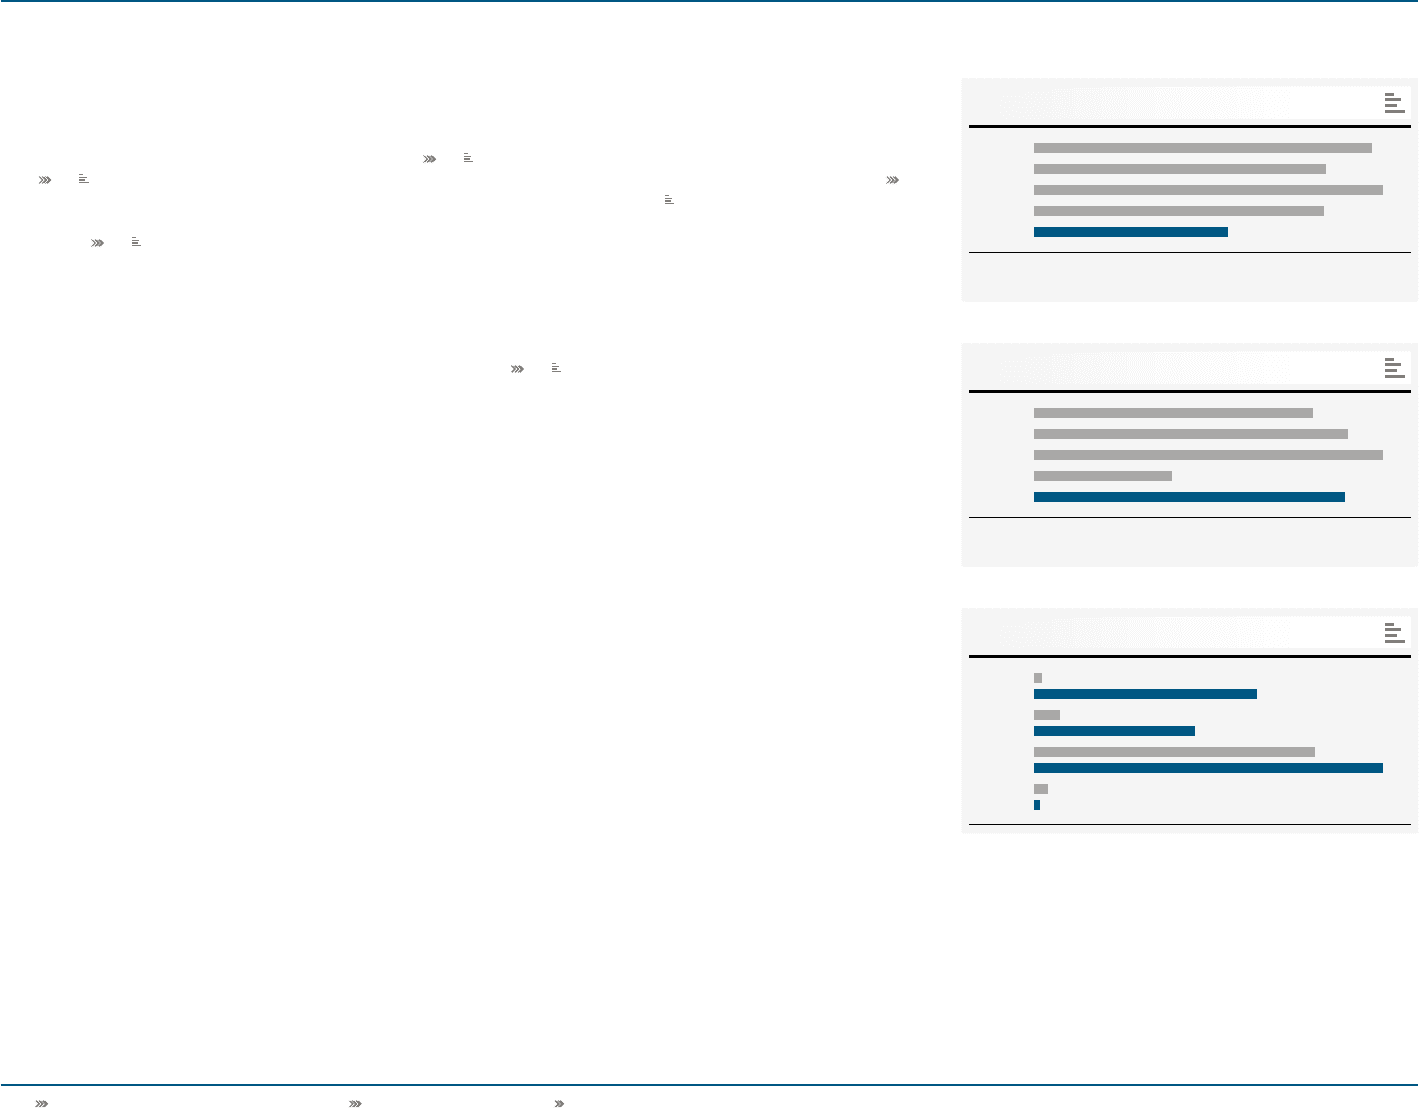
Income before taxes
€ in millions
1) Including Reebok, Rockport and Reebok-CCM Hockey from February 1, 2006
onwards.
26
27
2006 1 )
2007
2008
2009
2010
2006 1 )
2007
2008
2009
2010
197
170
203
169
113
723
815
904
358
806
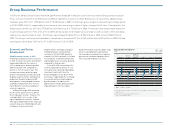
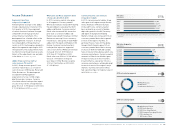
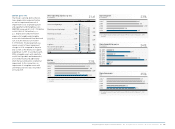
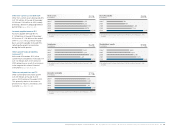
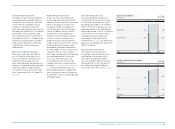
Income before taxes by quarter
€ in millions 28
Q1 2009
Q1 2010
Q2 2009
Q2 2010
Q3 2009
Q3 2010
Q4 2009
Q4 2010
9243
28 176
306 380
16
7
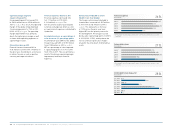
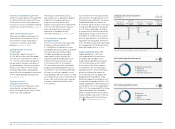
Operating margin improves
2.6 percentage points
Group operating profit increased 76%
to € 894 million versus € 508 million in
2009 see 23. As a result, the operating
margin of the adidas Group improved
2.6 percentage points to 7.5% in 2010
(2009: 4.9%) see 25. The operating
margin improvement was primarily
due to the higher gross margin as well
as lower other operating expenses as
a percentage of sales.
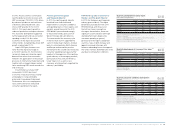
Financial income up 28%
Financial income increased 28% to
€ 25 million in 2010 from € 19 million in
the prior year, mainly due to an increase
in interest income as well as positive
currency exchange rate effects.
Financial expenses decrease 34%
Financial expenses decreased 34%
to € 113 million in 2010 (2009:
€ 169 million) see 26. The
non-recurrence of prior year negative
currency exchange rate effects as well
as lower interest expenses contributed to
the decline.
Income before taxes as a percentage of
sales increases 3.3 percentage points
Income before taxes (IBT) for the adidas
Group increased 125% to € 806 million
from € 358 million in 2009 see 27.
IBT as a percentage of sales improved
3.3 percentage points to 6.7% in 2010
from 3.5% in 2009. This was primarily a
result of the Group’s operating margin
improvement and lower financial
expenses.
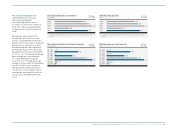
Net income attributable to share-
holders more than doubles
The Group’s net income attributable to
shareholders increased to € 567 million
in 2010 from € 245 million in 2009
see 29. This represents an increase
of 131% versus the prior year level.
Higher IBT was the primary reason for
this development. The Group’s tax rate
decreased 2.0 percentage points to 29.5%
in 2010 (2009: 31.5%), mainly due to the
non-recurrence of prior year charges
related to the write-down of deferred tax
assets.